| |||||||||||||||||||||||||||||||||||
| |||||||||||||||||||||||||||||||||||
Estimation of Mean Annual Precipitation
in Wyoming Using Geostatistical Analysis
Alexandra Kravchenko, Renduo Zhang
and Yeou-Koung Tung
Proceedings 1996 WWRC-96-04
Proceedings of American Geophysical Union
16th Annual Hydrology Days, April 15-18, 1996,
Fort Collins, Colorado, pp. 271-282.
Alexandra Kravchenko and Renduo Zhang
Department of Plant, Soil, and Insect Sciences
University of Wyoming
Yeou-Koung Tung
Wyoming Water Resources Center
University of Wyoming
Laramie, Wyoming
ABSTRACT
Precipitation is a function of many topographical land features as well as geographical locations. Spatial correlations between precipitation and topographical and geographical features can be used to improve estimation of precipitation distributions. In this study, kriging with external drift of topographical information was utilized for determining precipitation spatial distributions in Wyoming. Relationships between precipitation and elevation, slope, exposure, latitude, and longitude were used to improve the precipitation estimation. Application of the relationships in the external drift kriging resulted in reduction of kriging variance about 30 to 40% in different parts of the studied area with the maximum reduction up to 70%. The method was especially useful in mountain areas sparsely covered with observations. The external drift kriging allowed to utilize geographical coordinates in the estimation. The addition of geographical coordinates resulted in reducing kriging variance about 54% and increasing the correlation coefficient between observed and estimated values from 0.4 to 0.8 for the precipitation estimation.
INTRODUCTION
Rainfall information is an important input in the hydrological modeling, predicting extreme precipitation events such as draughts and floods, estimating quantity and quality of surface water and groundwater. However, in most cases, the network of the precipitation measuring stations is sparse and available data are insufficient to characterize the highly variable precipitation spatial distribution. This is especially true for mountain areas, where the complexity of the precipitation distribution is combined with the measurement difficulties. Therefore, it is necessary to develop methods to estimate precipitation in areas where precipitation has not been measured, using data from the surrounding weather stations.
Geostatistical methods have been shown to be superior to several other estimation methods, such as Thiessen polygon, polynomial interpolation, and inverse distance method (Creutin and Obled, 1982; Tabios and Salas, 1985). Geostatistical methods were successfully used to study precipitation spatial distributions (Dingman et. al., 1988; Hevesi et. al., 1992), extreme precipitation events (Chang, 1991) and contaminant distribution with rainfall (Eynon, 1988; Venkatram, 1988). One of the advantages of the geostatistical methods is to use additional information to improve precipitation estimations. Precipitation highly depends upon geographical and topographical land features. Incorporating the information in the geostatistical procedure can significantly improve precipitation estimations. Elevation is the most widely used additional information in the geostatistical analysis of precipitation distribution (Chua and Bras, 1982; Dingman et. al., 1988; Phillips et. al., 1992). However, other topographical information, such as terrain slope, exposure, orientation, geographical coordinates and barrier effect (Spreen, 1947; Schermerhorn, 1967), also has a profound influence on the precipitation distribution and could be added to elevation to explain precipitation variability. The objective of this study is to incorporate information about elevation, slope, exposure, and geographical coordinates into the external drift kriging procedure to improve the precipitation estimation.
MATERIALS AND METHODS
Rainfall data were collected over 50 years at 148 weather stations in Wyoming. The network of the elevation data on a 5x5 km grid was used to relate mean annual precipitation (MAP) to the topographical features. Elevation data for the state consisted of the 148 data points at the weather stations plus 7600 data points from the elevation grid. Slope and exposure were calculated based on the elevation grid (Spreen, 1947). Slope was obtained as a maximum range in elevation within a 8.045 km radius of the station and expressed in meters. Exposure of the station to the inflow of air masses was calculated as a sum of those sectors of a 32.18 km radius circle, centered at the station, not containing a barrier 304 m or higher above the station elevation (expressed in degrees of azimuth). In the geostatistical analysis we used logarithms of the slope and exposure.
Since detailed information about geostatistical procedures can be found in literature (Journel and Huijbregs, 1978; Isaaks and Srivastava, 1989), we only give a brief description of the geostatistical methods used in the study. The first step in the geostatistical analysis is to calculate sample variogram using following equation
g(h) = 1/2n åni=1 [Z (xi+h) - Z (xi)]2
where xi and xi+h are sampling locations separated by a distance h, Z(x) and Z(x+h) are measured values of the variable Z at the corresponding locations. The sample variogram is fitted with a variogram model and adequacy of the chosen model is tested using cross-validation technique. Statistics of cross-validation used to select the variogram model are the mean error between measured and kriging estimated values, the correlation coefficient between measured and estimated values and the reduced kriging variance (Zhang et. al, 1992). After a proper variogram model is chosen, kriging is applied to estimate the variable values at unsampled points using data from the surrounded sampled area. Kriging estimator is expressed as follows
Z*(x) = åni=1 liZ(xi)
where Z*(x) is an estimated value of Z at location x, l i is the weight of the observation at the location xi, and n is the number of observations within the searching neighborhood. The weights are determined based on the variogram model, which takes into account the spatial variability of the random variable. Kriging with external drift represents the kriging estimate Z*(x) as a sum of a trend component m(x) and a residual R(x), where the trend component m(x) is a linear function of the external drift variable y(x):
m(x) = a0 + a1y(x)
External drift variable y(x) was expressed by either elevation, or elevation combined with log- transformed slope and exposure, or elevation combined with geographical coordinates and log- transformed slope and exposure. In case of a combination of the several variables the external variable was expressed as a first order polynomial equation:
y(x) = b0 + b1y1(x) + b2y2(x) + b3y3(x)
This equation was a result of the multiple regression analysis conducted for MAP versus elevation, slope, exposure, and geographical coordinates; bi are the regression coefficients, yi(x) represent the variables used in the regression analysis. The geostatistical analysis is conducted using values of the residuals, as the difference between observed MAP values and values calculated from the regression equation.
RESULTS
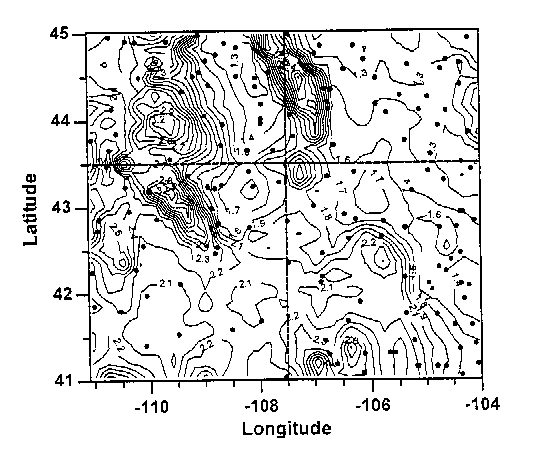
The territory of Wyoming was divided into four subregions to delineate the areas with possible homogeneous effect of geographical and topographical features on MAP. The main criteria in subregion delineation was to maintain a relatively high correlation between precipitation and topographical, geographical features and to have enough data points to perform meaningful multiple regressional and geostatistical analyses. The subregion division is shown in Fig. 1 with the elevation map of Wyoming and the precipitation data points.
Figure 1. The Subregion division with elevation map of Wyoming and locations of the observation stations.
Multiple regression analyses were carried out to quantify the relationship between precipitation variation and topographical, geographical features (Table 1). For all of the subregions multiple regressions with elevation, slope, exposure as well as latitude and longitude gave the highest correlation coefficients. Both northwestern (NW) and southwestern (SW) subregions had a relatively high correlation between MAP and topography as well as between MAP and geographical coordinates (Table 1). Positive correlation was observed between MAP and elevation and MAP and log(slope), while negative correlation between MAP and log(exposure). In the eastern part of Wyoming in both northeastern (NE) and southeastern (SE) subregions a significant correlation was found only between MAP and geographical coordinates.
The set of available data was relatively small for the studied territory. Gauge density for the whole state was equal to 1725 km2/gauge. As a result of low gauge density subregion delineation reflected only in a very general manner geographical and topographical influence on the precipitation distribution of the studied area.
Table 1. Results of regression analysis between MAP and topography
___________________________________________________________________________________
Subregion                 Correlation coefficients between MAP and
___________________________________________________________________________________
      	      1          2          3          4           5           6
___________________________________________________________________________________
 NW	   0.841      0.470   - 0. 720      -0.214     - 0.630	     0.907

 SW	   0.138      0.519   - 0.794	     0.464     - 0.528	     0.827

 NE	   - - -**    - - -     - - -        0.499	 0.224	     0.700

 SE	   - - -      - - -	- - -	   - 0.366	 0.640	     0.814

whole	   - - -      - - -	- - -	     - - -	 - - -	     0.565
state
___________________________________________________________________________________
* significant at a = 0.05To perform the geostatistical analysis we used a geostatistical package, Geostatistical Software Library (Deutsch and Journel, 1992). Sample variograms were computed for all of the subregions according to procedure described in the previous section. A spherical model was the best fitted the sample variogram of the southeastern subregion. For the rest of the subregions sample variograms were fitted with Gaussian models. Example of the sample variogram for the southwestern subregion is shown in Fig. 2a. Parameters of the variogram models for the northeastern, northwestern, southeastern and southwestern subregions are presented in Table 2.
Kriging with external drift requires variograms of the residuals as an input. Therefore, residuals were calculated as a difference between the observed values and values calculated using the regression equations. Sample variogram of residuals between MAP and all topographical features and geographical coordinates for southwestern subregion is shown in Fig. 2b. Parameters of the fitting models for residual variograms are listed in Table 2.
Figure 2. Variograms for the southwestern subregion: a) variogram for MAP;
b) variogram for residuals between MAP and elevation, log(slope),
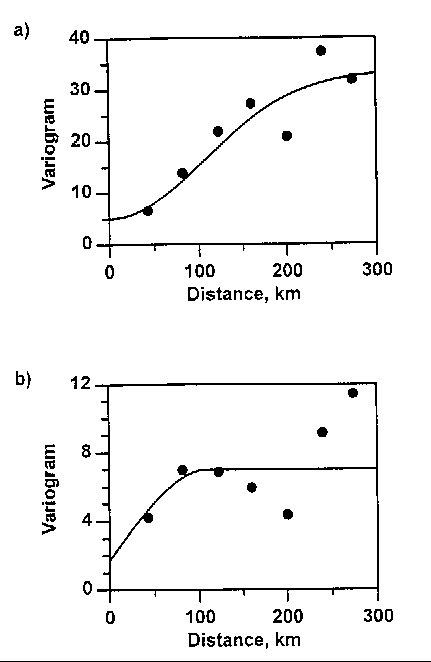
Table 2. Cross-validation results
_______________________________________________________________________________________
         Model        Nugget        Sill       Range       r (obs/est)      MKV
			                       (km)
________________________________________________________________________________________
        Northwestern subregion

OK	 Gaussian	5.0	   115.0       180.0        0.786          7.11

KED	 Gaussian	2.5	    14.5       130.0	    0.910	   3.67
						                          (48*)
_______________________________________________________________________________________
	Southwestern subregion

OK	Gaussian	5.5	    33.5       150.0 	    0.740	  9.14

KED	spherical	1.7	     7.0       110.0	    0.886	  5.60
						                          (39)
_______________________________________________________________________________________
	Northeastern subregion

OK	Gaussian	3.5	    10.5       150.0	    0.527	  4.33

KED	spherical	2.5	     4.0       130.0	    0.723	  3.69
							                  (15)
_______________________________________________________________________________________
	Southeast subregion

OK	spherical	1.0	    4	        80.0	    0.393	  2.68

KED	spherical	0.97	    1.18       110.0	    0.832	  1.23
							                  (54)
_______________________________________________________________________________________
	Whole state

OK	spherical	1.0	   16.5	        20.0	    0.836	  4.26

KED	spherical	2.0	   12.0	       220.0	    0.820	  4.87
_______________________________________________________________________________________
* Values in parentheses indicate relative reductions in the mean kriging variance (%).
To show the improvement in the MAP estimation by applying the additional topographic information in the kriging procedure, cross-validation results using the kriging with external drift (KED) were compared with those using the ordinary kriging (OK) (Table 2). Using additional topographical information significantly improved precipitation estimation in all subregions. In the northwestern subregion the correlation coefficient (r) between the observed and estimated values increased from 0.786 for the ordinary kriging to 0.910 for the kriging with elevation as an external drift. Mean kriging variance (MKV) was reduced to 48%. In the southwestern subregion the correlation coefficient increased form 0.740 of the ordinary kriging to 0.886 of the external drift kriging with three topographical variables. Kriging variance was reduced by 39%. In the northeastern and southeastern subregions addition of the geographical coordinates was the only possible source of improvement of MAP estimation (see Table 1). Its application in the external drift kriging resulted in much higher estimation precision than the ordinary kriging. Correlation coefficient increased from 0.527 to 0.723 in northeastern subregion and from 0.393 to 0.832 in southeastern subregion and kriging variance was reduced by 15% and 54%, respectively.
Cross-validation results for the whole data set are also shown in Table 2. Kriging with external drift with any combination of the additional topographic variables did not improve the estimation results of the whole data set at all. Estimation results from all subregions were combined in one data set and then compared with estimation results obtained from analysis of the whole data set. The estimation results obtained from the combined subregions were overall better than those from the whole state. Correlation coefficient increased from 0.83 to 0.93, kriging variance was reduced in average of 48% with maximum value of kriging variance reduction up to 68%.
Since external drift kriging with three topographical variables and geographical coordinates produced the best cross-validation results, it was used as a procedure to construct the precipitation distribution maps of the subregions and the entire state. Figures 3a, b, c, and d show maps of the precipitation distribution in northeastern, northwestern, southeastern and southwestern subregions, respectively. In general, the precipitation maps of the subregions gave reasonable precipitation distribution patterns that reflected main topographical land features and changes of precipitation from west to east and south to north. However, one definite inconsistence was found between precipitation map of the southwestern subregion and the results expected from brief analysis of the subregion relief. The northern part of the southwestern subregion is occupied by the Wind River Range with area about 13,000 km2 and elevation ranged from 2.0 to 3.9 km. It was expected that such a significant increase in elevation would be reflected in the precipitation distribution. However, only very slight increase in amount of precipitation was observed in this area on the precipitation map. The reason is that the mountain area was not covered with any observation stations. As a result the regression equation for the southwestern subregion showed a little influence of elevation on MAP as that typical for the rest of the subregion territory covered mostly by plains.
Mean kriging variances obtained from the external drift kriging with topographical information and geographical coordinates for subregions were equal to 4.29, 4.10, 1.78 and 5.41 for the northeastern, northwestern, southeastern and southwester subregions, respectively. Maximum values of kriging variance were found in the areas with the smallest amount of observation points. Mostly it was high mountain areas, such as Grand Teton in the northwestern subregion and Big Horn mountains in the northeastern subregion. The lowest kriging variances were observed in the southeastern subregion with the largest number of observation data points.
SUMMARY
Geostatistical analysis was applied to study spatial distributions of the mean annual precipitation in Wyoming. Relationships between mean annual precipitation and topographical features, such as elevation, slope, exposure, and geographical coordinates were investigated and utilized in the geostatistical procedure of kriging with external drift. The relationships between topographical features, geographical coordinates, and precipitation varied in different regions. Subsequently, improvement due to additional information of the topographical features in the geostatistical procedures varied in different areas as well. However, in all cases the additional information resulted in significantly higher precision of the precipitation estimation than ordinary kriging. The territory of the state was divided into subregions with relatively high correlation between precipitation and topographical features, geographical coordinates and geostatistical analyses were carried out for the subregions. External drift kriging allowed to include not only topographical features but also geographical coordinates in precipitation estimation. It was especially usefull for areas where precipitation was only correlated with geographical coordinates. Kriging with external drift with elevation, slope, exposure and geographical coordinates produced the best precipitation estimation results.
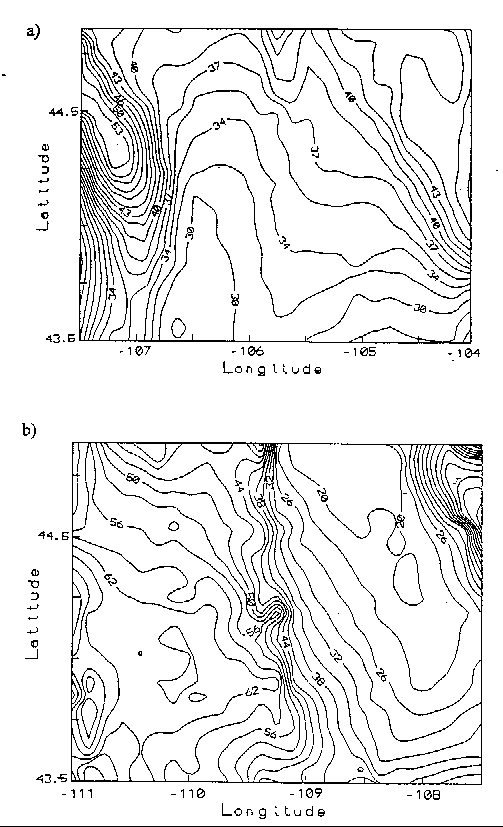
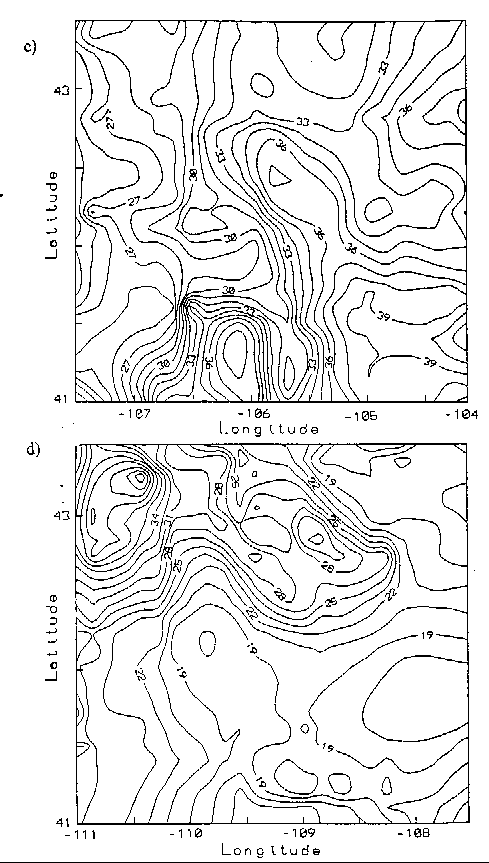
Figure 3. Maps of spatial distribution of mean annual precipitation constructed using external kriging
with elevation, log(slope), log(exposure), latitude and longitude for a) northeastern subregion;
b) northwestern
subregion; c) southeastern subregion; d) southwestern subregion.
REFERENCES
Water Resources Publications List
Water Resources Data System Library |
Water Resources Data System Homepage