| |||||||||||||||||||||||||||||||||||
| |||||||||||||||||||||||||||||||||||
HYDRAULICS LABORATORY
The experiments with the long crested weir were performed
in the Hydraulics Laboratory of the Civil Engineering
Department at the University of Wyoming. The long crested
weir was placed in a concrete open-channel in the floor of the
laboratory. This channel is three feet wide and four feet
deep and is about seventy-two feet long, running nearly the
entire length of the laboratory. Although some sections of
the channel floor appeared to be slightly depressed or
elevated relative to adjacent channel sections due to the
nature of the concrete finishing, the channel has no overall
slope, and the elevation of the channel floor does not vary by
more than about one-half inch over its entire length.
The Laboratory is equipped with a series of Bell & Gosset centrifugal pumps which pump water from a reservoir or sump in the laboratory basement and circulate it within the laboratory. An eight inch diameter pipe carries the water from the pump room to the far end of the laboratory where it passes through a manifold and series of valves before being discharged into the concrete open-channel. once in the open- channel, the water flows back toward the sump and pump area. At the end of the open-channel is a diverter tank which directs the flow into two Fairbanks weighing tanks which can be used to determine the flowrate in the channel. The weighing tanks empty into the reservoir or sump, so that the water can be recirculated back to the channel again.
The Fairbanks weighing tank system is an electronic weighing system. The valves on the diverter tank and the two weigh tanks are actuated by pneumatic pistons which are electronically controlled. Weights of the tanks are determined with a strain gage system. The weighing system is controlled by an electronic timer which can be set to a specified number of seconds. If the timer is set for sixty seconds, for example, then when the weighing system is started (by pushing the START button on the control panel), the valve in the diverter tank which empties into tank A will open, and the valve to tank B will simultaneously close. The valve at the bottom of tank A will be closed, and the entire flow from the open channel will pass through the diverter tank into tank A for sixty seconds. At the end of sixty seconds, the diverter tank valves will switch positions so that the valve to tank A will now be closed, and all of the flow will pass through the open valve into tank B. As the diverter tank valve to tank B opens, the valve in the bottom of tank B will shut, so that the flow is contained in the tank for the next sixty seconds. Tank A will stabilize within a few seconds, and the weight will automatically be recorded and printed out at the control box. After the weight is printed, the valve in the bottom of tank A opens to empty the water from the tank by gravity into the reservoir below. After tank B has filled for sixty seconds, the diverter tank valves will switch and start filling tank A again while tank B is weighed and emptied. For medium and low flows the tanks could be operated continuously because sixty seconds is enough time for tank A to empty while tank B is filling (and vice versa), but at high flows some problems were created which will be discussed in the procedures section.
The flowrate of the water being pumped into the open-channel could be controlled in two ways. Since there were four pumps connected in parallel, the flow could be varied simply by turning the pumps on or off. This only allows for four flowrates, with the maximum flowrate provided by all four pumps operating simultaneously and the minimum flowrate provided by just one pump. The other way to control the flowrate was to adjust the setting of the valves in the pipe which discharged into the open-channel. These flow control methods were used together during the experiments involving the long crested weir.
LONG CRESTED WEIR
The weir crest was made of aluminum plates that could be
interchanged in assembly to provide different shapes of weir
configuration. The side crest sections were 11.75 inches
tall and 3/16 inches thick. The top edge was machined to form
a sharp crest with a top thickness of about 0. 08 inches (2
mm). The side crest sections were originally 3.99 feet long,
but were later cut and machined to lengths of 3.00, 2.00, and
1.00 feet as the experiments progressed. Two lengths of one
inch steel channel were attached to the side crest sections to
reinforce and strengthen them. The downstream crest sections
were also 11.75 inch tall aluminum plates and machined to have
a crest which matched the sharp crest of the side sections.
The downstream crest sections were attached to the side crest
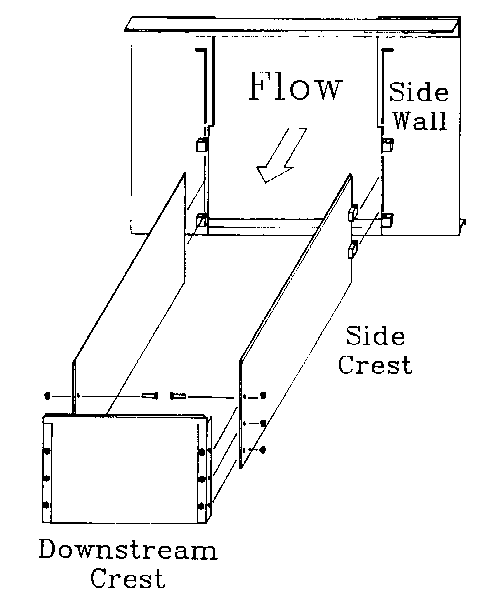
sections with screws and nuts (Figure 4). The holes for the
screws were drilled so that the screw heads mounted flush with
the upstream face of the weir; this minimized any detrimental
effects the screw heads may have had on streamlines or
upstream flow conditions. The screws were also located far
enough below the crest so that in free-flow conditions the
nuts attached on the downstream side of the weir did not
interfere with the free jet of water flowing over the weir.
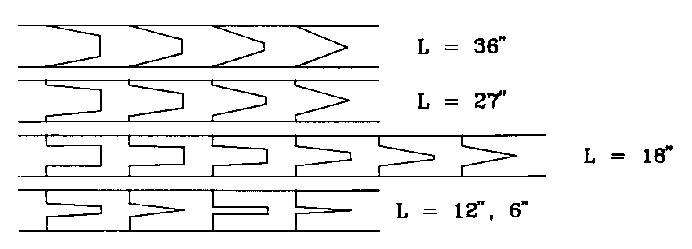
The downstream crest sections were 18, 15, 12, 9, 6, and 3
inches wide; experiments were also conducted with no
downstream crest section at all, and the two side crest
sections were connected at their ends to form a weir in the
shape of a "VI' in plan view (Figure 5).
The upstream sidewalls of the weir were also made of interchangeable aluminum plates. These plates were of the same thickness as the crest pieces, but they were two feet tall and had varying widths to produce different throat widths for the weir. The weir throat widths that were used in the experiment were 36 inches (no sidewalls), 27 inches, 18 inches, 15 inches, 12 inches, 9 inches, and 6 inches. The sidewalls were attached at the top and bottom to brackets fastened to the concrete floor and sides of the open channel. The side crest sections were attached to the sidewalls with hinges which allowed flexibility in testing several different downstream crest sections without having to disconnect the side sections from the sidewalls. The sides of the sidewalls which became the throat of the weir were machined to form vertical sharp crests similar to the sharp crest of the side crest sections. This produced a weir crest similar to the sharp crests on the sides of a regular sharp crested contracted weir.

Figure 4. Exploded View of the Weir Crest Assembly.

Figure 5. Plan Geometry of Weirs Tested with Sl=4 ft.
Because the contact of bare metal with concrete did not provide a good seal, a sealant was used to prevent excess leakage around and under the weir. Various types of caulk were tested, and of the sealants tested, GE Silicone II was the sealant that proved to be most effective for this particular application. It was easily applied, had a relatively quick curing time, and was easy to remove. However, for the silicone to stick, the surfaces had to be dry. The concrete channel could be dried sufficiently in about 45 minutes using a squeegee, a mop, rags, and blow dryers in preparation for the next silicone seal. The seals were not perfect and did not eliminate all leakage, but the leakage was very small and considered insignificant compared to the flow over the weir during the experiments. If a seal permitted what appeared to be a significant amount of leakage, attempts were made to plug the leaks; and if these proved unsuccessful, the channel was drained, dried, and a new seal installed.
DEPTH MEASUREMENT
The depth of flow was measured mechanically using three
point gages with Vernier Scales. The scales read to 0.001
feet. The gages were mounted over the center of the channel
at the throat entrance, 1.25 feet upstream of the throat, and
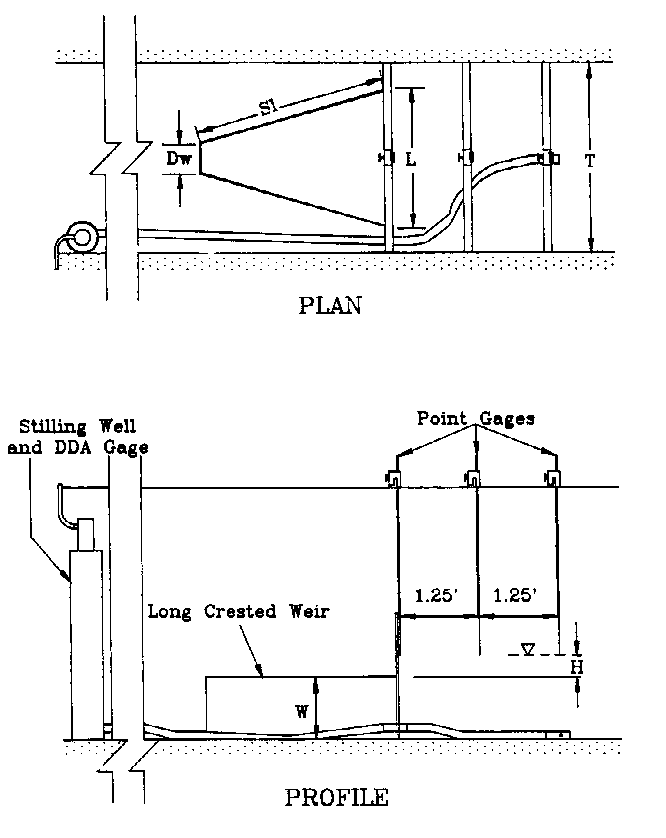
2.50 feet upstream of the throat (Figure 6). The only gage
reading that was used to evaluate the discharge coefficient
was the reading on the gage at 2.50 feet upstream of the weir
throat (the other readings were taken for possible use in
future flow studies). The literature recommended taking the
depth measurement at an minimum upstream distance of four
times the head on the weir (Kraatz and Mahajan, 1975). The
gage 2.50 feet upstream of the throat was positioned there so
that at a maximum head of 0.5 feet on the weir the gage would
be at an upstream distance of five times the maximum expected
head on the weir.
The depth at 2.50 feet upstream of the throat was also measured electronically using a Level Plus (TM) Direct Digital Access (DDA) Industrial Tank Gage produced by MTS Systems Corporation. The DDA gage was installed in a stilling well made of 6 inch diameter PVC pipe and located downstream of the weir. A metal plug with small holes drilled in it was put in the end of a 5/8 inch diameter plastic hose and fastened to the floor of the channel 2.50 feet upstream of the weir throat and directly beneath the point gage. The plastic hose extended to a pipe through one of the weir sidewalls, and another plastic hose on the downstream side of the weir connected the pipe in the sidewall to the stilling well. This arrangement allowed the water surface in the stilling well to be the same elevation as the water surface in the channel 2.50 feet upstream of the weir throat, and it allowed the DDA gage to measure the same changes in head that were being measured with the point gage. The small size of plastic pipe and the small holes in the plug restricted the flowrate to the stilling well and dampened the influence of waves in the channel so that the water surface in the stilling well gave an average water surface rather than showing a peak and trough for every wave moving down the channel. The stilling well was fastened to the wall of the channel about 8.5 feet downstream from the weir sidewalls; this distance was enough to insure that the presence of the stilling well in the channel did not interfere with flow over the weir.

Figure 6. Views of the Weir Installation.
The gage was connected to a 286 IBM compatible computer. Since the electronic signal from the gage had to be translated into a signal that the computer could interpret (and vice versa), a PC-422/485 Serial Interface was installed in the computer to allow communication between the DDA gage and the computer. A DDA-PC communications software program was provided by the MTS Systems Corporation. This program allowed a certain degree of programming of the DDA gage and provided the necessary communication commands to get the depth readings from the gage. Commands to the DDA gage were issued in Hex code by direct input from the computer keyboard. The gage readings were displayed on the computer screen and recorded on data sheets. The gage reading was in inches, and the depth readings displayed on the computer were to three decimal places (0.001 inches).

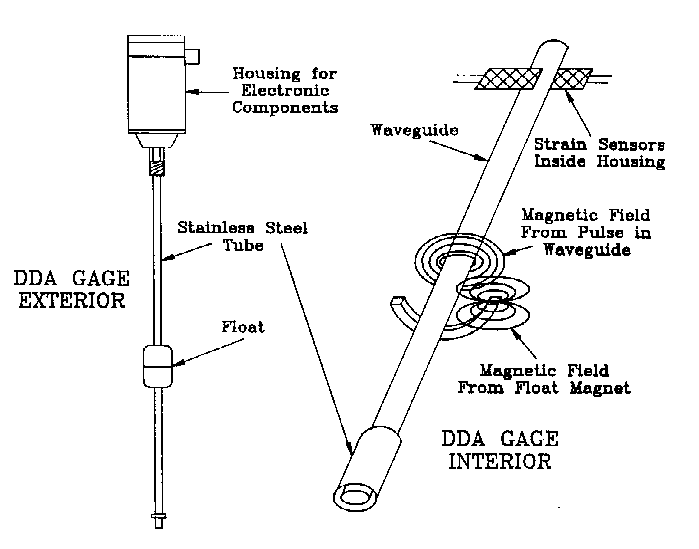
Figure 7. The DDA Gage
The initial stage in the experimental procedure was the preliminary measurements and gage settings. Before starting the experiment, measurements were made of the weir side crest length, the downstream weir crest width, and the weir throat width. These measurements defined the exact weir configuration and were used in developing the Pi terms and coefficient of discharge used in the data analysis. Since our only interest was in measuring the head on the weir--in other words, the depth from the water surface to the weir crest elevation--and not the total depth of water in the channel, the gages were initially set to the elevation of the weir crest. This was done by filling the channel with water upstream of the weir until water was flowing over the weir, and then stopping the pump. When the water stopped flowing over the weir, the zero-flow condition was set, and the water surface behind the weir was essentially at the elevation of the weir crest. The point gages were adjusted to where their points were just touching the water surface, and the gage readings were recorded on the data sheet. Accordingly, the water surface in the stilling well was also at the elevation of the weir crest, and the DDA gage reading was set to 0.000 inches. The DDA gage could then give a direct measure of head in inches; the head readings given by the point gages had to be calculated by subtracting the initial zero-flow reading from the reading taken during the experiment.
After the preliminary measurements and gage adjustments had been made, the weir was ready for flow. The pumps were turned on, and the flow in the open-channel was allowed to stabilize for several minutes. Then the point gages were readjusted so that their points were again just touching the surface of the water. During the high flows there were waves in the channel, and the point gages were set so that they would be touching the water approximately half the time and out of the water the other half of the time. This was done to try to get an average water surface with an elevation midway between the elevation of the wave's crest and trough. These point gage readings were recorded on the data sheet, and then the reading was taken from the computer f or the DDA gage. Several readings were taken from the DDA gage to insure that the water surface in the stilling well was not changing significantly, and then the DDA gage reading was recorded on the data sheet. The head readings for the DDA gage and the point gage at 2.5 feet from the weir were compared to make sure they agreed. If there was a large discrepancy, the readings were taken again. This comparison helped catch any misreading of the gages or other human error before moving on to the next step in the procedure. At this time, notes were taken regarding visual observations of flow conditions over or through the weir.
The weight readings came next. The timer was set on the control panel and the weighing system was started. For the medium and low flows, tank A would fill then the flow would switch to tank B. A weight would be automatically printed out for tank A, and it would empty while tank B was filling. By the time the timer switched the flow from tank B back to tank A, tank A had emptied. Tank B would print the weight then empty while tank A was filling again. In this way, the flow could switch continuously from one tank to the other as the weights were being printed out. Occasionally one of the diverter valves would not open all the way when the system was first started, and this would reduce the flowrate into the tank and give a f aulty weight reading. Therefore, if the weights from the two tanks didn't agree close enough, the weighing process was repeated until acceptable weight readings were obtained. Then two weights from tank A and two from tank B were recorded on the data sheet. The procedure was a little different for the high flows because tank A could not drain fast enough to be empty by the time the timer switched the flow back from tank B. This required that tank A be filled and weighed and tank B filled and weighed, but then the weighing system had to be stopped and the tanks allowed to drain before starting again. otherwise, the flow would switch from tank B back to tank A, and tank A would still have water (possibly several thousand pounds) from the first weighing and give a faulty weight reading the second time.
Performing various calculations was the third part of the procedure. The channel flowrate was calculated by averaging the four recorded weights (two each from tank A and tank B), dividing this average weight by 62.4 pounds per cubic foot of water, and then dividing by the number of seconds set on the timer of the weighing system. This calculation produced a flowrate in cubic feet per second. The value of the experimental coefficient of discharge was also calculated using the head, the flowrate, and the total length of weir crest. Some dimensionless Pi terms were also calculated. Performing the calculations at this stage in the experiment took only a few minutes and gave an indication of whether or not the data were following a regular pattern or if something unusual was happening.
Once the data were taken and the calculations performed, the pumps and valves were adjusted for the next flowrate. Depending on the flowrate and the weir configuration, sometimes the only adjustment made was to turn off a pump and let the flow in the channel stabilize again. At other times a pump would be turned of f and a valve closed to further restrict the flow. The depth of flow in the channel gave visual indication of the flowrate adjustment, and the flowrate was adjusted to give a fairly uniform spread of head measurements between the highest and lowest values. The flowrate was adjusted based on the change in water surface elevation in the channel; although the actual flowrate was determined using only the weigh tanks, it was obvious that a small change in head produced a change in flowrate over the weir. Careful adjustments of the valves and pumps could produce somewhat consistent changes in head on the weir and at the same time produce somewhat consistent changes in flowrate over the range of flowrates used with each experimental weir. With some experience it was possible to adjust the flow rapidly and with consistency simply by observing the change in flow depth brought about by the valve and pump adjustments. After the flow depth (and therefore, the flowrate) was adjusted satisfactorily, the gage readings, weigh tank readings, and calculations for this new flowrate were performed. This process of adjusting the flowrates and taking the data was repeated on average seven times for each weir configuration.
After the testing of the weir for the various flowrates was complete, the channel was drained and dried, and the old weir configuration was replaced with a new one to be tested. Draining the channel was accomplished by removing the downstream crest width of the weir. The silicone caulk was removed from the metal weir plates and the concrete channel, and the area of the channel where the new weir configuration would be positioned was dried using a squeegee, a sponge mop, cloth rags, and blow dryers. If the new weir configuration required only a change of the downstream crest width and not a change of throat width, then the caulk was removed only from the crest pieces, but the silicone seal at the sidewalls was left intact. The side crest pieces were repositioned and a new downstream crest piece installed. Then all of the joints of the crest pieces were sealed with silicone caulk. If the throat width was to change, the crest sections and the sidewalls were removed from the channel. The caulk was removed from the channel walls and floor, and then the new sidewalls and crest sections were installed and sealed with caulk. This procedure was done for the 67 separate weir configurations that were tested.
93-13 Table of Contents
Water Resources Publications List
Water Resources Data System Library |
Water Resources Data System Homepage