| |||||||||||||||||||||||||||||||||||
| |||||||||||||||||||||||||||||||||||
MODEL FORMAT
A determination of which tributary streams to the main stream
segments to be included as a part of the model was the first step in
the definition of the model format. Although the Green River
(Figure 3. 1) and its major tributaries are obviously included,
judgment is required initially on which smaller streams and stream
segments are required in order for the model to produce a
satisfactory water accounting.
Each water right diversion was first placed on a set of maps (1:100,000 scale) to see which streams or stream segments could be eliminated due to their lack of water right diversions and/or runoff volume being insignificant to the water balance of the basin as a whole. After eliminating these streams, the locations of gauging stations were charted on the maps. This allowed for the determination of streams with few water rights diversions on them and no headwater runoff data availability to be grouped and a decision made on whether or not to include these streams or stream segments in the model. Those with small drainage areas and small water right diversion amounts were initially deleted. It was assumed that the water right diversion amounts and the amount of runoff from these streams or stream segments canceled each others' effect on the system. Those that were included were typically the streams that had the larger drainage areas and
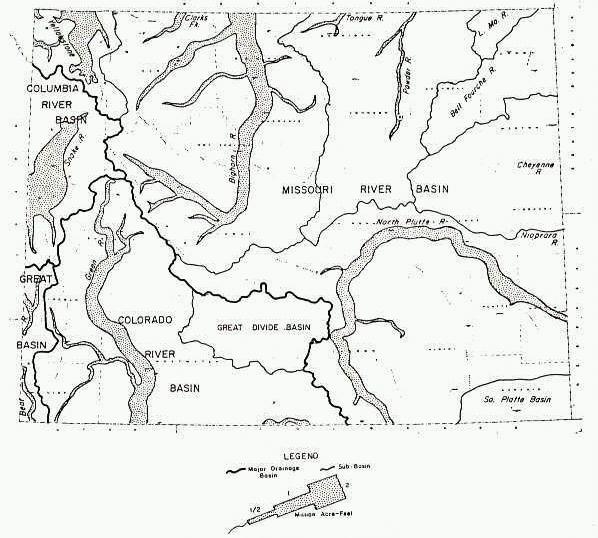
Figure 3.1. Wyoming Map Indicating Green River Basin Boundaries. The speckled areas represent average annual streamflow in million acre-feet.
few or even no diversions. A list of all the streams eliminated from the model appear in Table 3.1. If a larger stream was eliminated, all its tributaries were obviously expunged as well.Another simplification to the stream system resulted in Middle Piney and South Piney Creeks being combined. Primarily, this was done due to their extreme proximity within the same land sections, throughout most of. their reaches, and the fact that water is diverted from one to the other.
Table 3.1 - Streams Not Included in Green River WIRSOS Model. Asterisks (*) denotes streams with diversions.
| Salt Wells* | Black Butte | Roaring Fork |
| East Muddy* | Alkali* | Spring |
| Wagon* | Tosi | Klondike |
| Lime | Eagle | Whiskey |
| Rock | Wagonfeur* | Badger |
| Big Twin* | Little Twin* | Mud* |
| Spring* | North Beaver* | Forty Rod* |
| Muddy* | Muddy* | Dry Piney* |
| Birch* | Muddy* | Sheep* |
| Shute | Little Beaver | Sweetwater |
| Killpecker on Bitter Creek | Little Pacific | Dry Sandy |
With the stream pattern developed, stations could be located. The first ones utilized were the headwater stations (Figure 3.2). These stations were located at all the headwaters of the streams and rivers being modeled. The
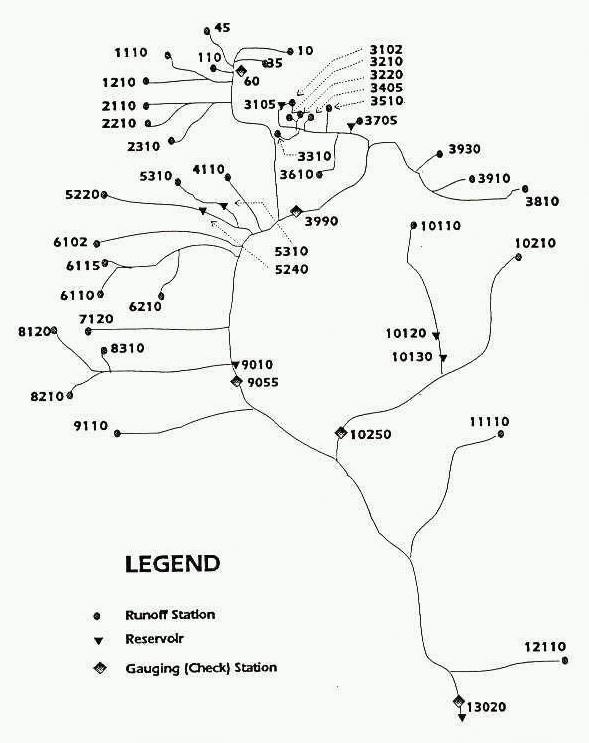
Figure 3.2. Significant Green River WIRSOS Modelling Stations. The numbers represent station numbers assigned to all the main stations in the model
numbers shown on Figure 3.2 represent the station numbers assigned to all of the main stations used in the model. Although some station numbers were conveniently located next to or at gauging stations, all headwater stations must eventually have runoff assigned to them before the model can be run. The manner in which runoff was assigned to the headwater stations will be discussed further in the runoff section.The stations below headwater stations were generally at the confluence of one or more streams or at the confluence with one of the major streams draining the Green River basin. Wherever a modeled river, stream, creek, or even wash merged into another body, a station had to exist so that the system could reliably be described in the model. The final stations to be utilized were the stations located to include the diversions. once again studying a map of the plotted diversion locations, stations were placed for grouping of diversions that were not yet near one of the other types of stations. This allowed for the relating of each diversion to a specific station. With the stations now located and the stream exclusions resolved, the actual details of the model could be decided upon and organized into working formats.
DIVERSIONS
As one of the only two required inputs, the choices made
concerning each diversion are keys to the reliability of the model.
The most fundamental problem of which diversions to model demanded
the attention of the State Engineer's Office. With their guidance,
only the diversions having adjudicated status were used in this
version of the model. The decision also included the exclusion of
the permits for oil and gas production, highway construction, stock
water, supplemental supply, and pollution control. This reduced the
number of permits on the system from over 2400 to just over 1200.
With the type of diversions now defined, the actual information f or
each one was inserted bringing up several points of concern.
The primary consideration dealt with the efficiency and return flow of each diversion. For this information, a study of the upper New Fork River region was consulted (Wetstein, 1989). This investigation analyzed the diversions, withdrawals from the river and the amounts of water that returned in the form of overland flows and return flows. To encompass varying climatic conditions, a study on return f lows on the New Fork River was conducted from 1985 to 1988. These f our years contained one dry year. The data from this year were used to approximate a diversion efficiency and to calibrate the delay table for return flows for irrigation permits. For all other permits (municipal and industrial), one hundred percent of the return flow reentered the system the next month based upon short retention times during these uses. All return flows are modeled to reappear at the next downstream station regardless of the type or location. This simplification should make no noticeable difference in the river flow since most return flow occurs in months of reduced irrigation use. These approximations comprised the bulk of the estimations for diversions, and with data backing up most of the numbers, their accuracy was assured to be within reason of the actual values. However, several adjustments did result during the calibration phase.
The last debate over the diversions was on how to distribute their permitted values throughout the year. The industrial and municipal permits were the simplest of all. It was speculated that their withdrawals would remain essentially constant throughout the year. So, their permitted value was allotted year round. The irrigation permits, however, presented problems. Since the water use is seasonal, a distribution had to be evaluated that would give a close approximation of the actual use. For this information, distributions used with the Wind River WIRSOS model were attained and used. The actual distribution that was applied to this model is displayed in Table 3.2. This was the initial distribution used for calibration; however, this does not represent the final distribution used in the model. With all the permits now distributed, the diversion file was completed and other obstacles such as runoff could be addressed.
RUNOFF
Table 3.2 - Monthly Green River Basin Irrigation Diversion Percentages
| Month | Percent of Permit |
| January | 0 |
| February | 0 |
| March | 0 |
| April | 5 |
| May | 45 |
| June | 100 |
| July | 100 |
| August | 80 |
| September | 40 |
| October | 5 |
| November | 0 |
| December | 0 |
Along with the diversion file, the runoff file is required and of major importance. The first step in the construction of this file involved looking at the headwater stations and determining which runoff stations could be used. After the available data from these stations were recovered, a judgment was made on what years to include in the study. Only ten years (1961-1970) of data were chosen since they were common among most of the fifteen runoff stations which were available. The runoff stations that had the appropriate data and were included in the model are presented in Table 3.3. The other headwater stations were then ratioed to one of three runoff stations to determine their monthly flows throughout
Table 3.3 - Green River Model Runoff Data Stations.
| USGS Station Number | WIRSOS Model Station | Station Location |
| 091895.00 | 1210 | Horse Creek, Sherman Ranger Station |
| 091930.00 | 3102 | New Fork River below New Fork Lake |
| 091965.00 | 3405 | Fremont Creek above Fremont Lake |
| 091985.00 | 3510 | Pole Creek below Half Moon Lake |
| 091995.00 | 3610 | Fall Creek near Pinedale, WY |
| 092030.00 | 3810 | East Fork River near Big Sandy, WY |
| 092040.00 | 3930 | Silver Creek near Big Sandy, WY |
| 092055.00 | 5220 | North Piney Creek near Mason, WY |
| 092125.00 | 10110 | Big Sandy River at Leckie Ranch |
| 092140.00 | 10210 | Little Sandy Creek near Elkhorn, WY |
the ten years. The scaling was accomplished by reducing the associated runoff data to a unit value based on one square mile; then, these monthly values were multiplied by the approximated drainage area for each unknown headwater station. Since the streams were only compared with those of similar topography, configuration and elevation, the assumption was made that similar areas will have similar runoffs. This theory also demands that runoff is linearly dependent only on the drainage area for areas of similar elevation (Lowham, 1976). For this reason, the basin was divided into three regions; the north-eastern mountains, the southern slopes, and the north-western slopes. The runoff stations used for each region were respectively: 091965.00, 092055. 00, and 091895.00. The names of these stations are also located in Table 3.3. Tables 3.4 through 3.6 list which headwater stations were included in each region.
Table 3.4 - Headwater Stations Figured from Station 092055.00 (58.00 mi^2) for the Green River Basin Southern Slopes Region
| Model Station | Headwater Station for | Drainage Area (Mi^2) |
| 2110 | Cottonwood Creek | 50.0 |
| 2210 | Killpecker Creek | 16.0 |
| 2310 | South Cottonwood Creek | 45.0 |
| 4110 | Meadow Canyon Creek | 13.0 |
| 5310 | Above McNich Res. | 18.0 |
| 6102 | Middle Piney Creek | 34.3 |
| 6110 | South Piney Creek | 46.0 |
| 6115 | Fish Creek | 23.0 |
| 6210 | Beaver Creek | 25.5 |
| 7120 | LaBarge Creek | 122.0 |
| 8120 | Fontenelle Creek | 96.0 |
| 8210 | Roney Creek | 11.0 |
| 8310 | Dutch George Creek | 16.0 |
| 9110 | Slate Creek | 34.0 |
| 11110 | Alkali Creek (factored) | 282.0 |
| 12110 | Bitter Creek (factored) | 758.0 |
One problem did exist with this technique, however. For Bitter Creek and Alkali Creek, the only available data were annual peak flood values. No suitable runoff station existed in the area that would allow for a comparison. Since the type of drainage area differed greatly from that of the other regions, these stations could not be directly compared to any of the other stations in the system. This problem was circumvented by first taking the ratio of annual peak flood values and using this as an added factor in the method described for the other headwater stations. Although this method seems overly simplified, the data for these stations is only being used to account for the large drainage areas that they control. If this method results in erroneous data, the calibration portion of the project will correct it by either adjusting the factor in some manner or eliminating the stations altogether. An adjustment was required through the calibration process.
Table 3.5 - Headwater Stations Figured from Station 091965.00 (75.8 mi^2) for the Green River Basin North-Eastern Mountains Region.
| Model Station | Headwater Station for | Drainage Area (mi^2) |
| 10 | Green River Lakes | 116.0 |
| 3210 | Willow Creek | 41.8 |
| 3220 | Lake Creek | 44.0 |
| 3310 | Duck Creek | 27.0 |
| 3705 | Boulder Creek | 115.0 |
| 3910 | Cottonwood Creek | 30.0 |
Table 3.6 - Headwater Stations Figured from Station 091895.00 (43.0 mi^2) for the Green River Basin North-Eastern Mountains Region.
| Model Station | Headwater Station for | Drainage Area (mi^2) |
| 110 | South Beaver Creek | 30.0 |
| 1110 | South Horse Creek | 32.0 |
RESERVOIRS
A basic question to be answered was which reservoirs to include.
Once again, the State Engineer's Office was consulted. It was
decided that in this stage of the model
only major reservoirs had to be included. This translated into a
minimum of one thousand acre-feet storage for a reservoir. With this
standard and the additional criterion that they must be permitted and
adjudicated, only seven reservoirs qualified for the model. One
reservoir, Fremont Lake, met these specified standards but was not
included since there was no correct area-capacity relationship and no
available data to create one. Table 3.7 lists the seven reservoirs
along with some of their physical properties that were employed with
the model.
Along with the properties shown in Table 3.7, WIRSOS demanded other characteristics of the reservoirs. The most essential and involved is the area-capacity relationships. These are equations, in chapter 2, that relate the volume in storage to a surface area so an evaporation amount can be calculated. Although any permit for a reservoir must contain the relationship between these two factors, they are commonly in a table or graphic format. This forced a regression to be completed on each reservoir to fit the data to a model curve. As with any curve fitting, some error was introduced. To further embellish this error, all the reservoirs had to be fit
Table 3.7 - Reservoirs in Green River WIRSOS Model.
| Reservoir | WIRSOS Model Station | Minimum Storage (acre-ft) | Maximum Storage (acre-ft) |
| Fontenelle Reservoir | 9010 | 81031. | 345397. |
| Boulder Lake | 3705 | 0. | 37800. |
| New Fork Lake | 3105 | 4000. | 25700. |
| Sixty-Seven Reservoir | 5240 | 0. | 7090. |
| McNinch Reservoir | 5310 | 0. | 1620. |
| Big Sandy Reservoir | 10120 | 1400. | 54400. |
| Eden Reservoir | 10130 | 0. | 20209. |
to a linear relationship since any form of the logarithmic relation would cause an error in WIRSOS resulting from the fitted curve giving negative values for the reservoir area during times of extremely low volume. The coefficients that were attained for the linear fits are presented in Table 3.8. Along with these numbers, the R-squared value indicates the accuracy of each fit.
Table 3.8 - Green River Basin Reservoirs' Regression Coefficients.
| Reservoir | CF1 | CF2 | CF3 | R-SQUARED |
| Fontenelle Reservoir | 845. | 0.023 | 1.0 | .949 |
| Boulder Lake | 1511. | 0.007 | 1.0 | .994 |
| New Fork Lake | 1290. | 0.006 | 1.0 | .997 |
| Sixty-Seven Reservoir | 128. | 0.041 | 1.0 | .918 |
| McNinch Reservoir | 74.1 | 0.028 | 1.0 | .969 |
| Big Sandy Reservoir | 131. | 0.058 | 1.0 | .972 |
| Eden Reservoir | 405. | 0.047 | 1.0 | .887 |
A slight dilemma also existed in finding proper values for the monthly evaporation rates. Since none of the reservoirs contained stations with evaporation data, another station within the basin had to be found. The information needed was found to exist at station number 483170 in Farson, Wyoming. Although this location was not next to any of the reservoirs, it was decided that these values would accurately represent the evaporation at all the reservoirs in the model. Since only one year of evaporation rates are permitted in WIRSOS, average evaporation rates were calculated from the ten year study period. In addition to the averaging, the Farson station only contained data for the months of May, June, July, August, and September. To augment these data, a study on evaporation rates in Wyoming was used to extrapolate the remaining months (Lewis, 1978). For these values, a correlation was made between the evaporation in June and that of the missing months. This completed the data and allowed for a representative year of evaporation to be installed into the model (Table 3.9).
Table 3.9 - Monthly Evaporation Rates and Non-project Release Percentages in Green River Basin (Lewis, 1978).
| Month | Evaporation Rate (ft/mo./ft^2) | Non-project releases (% of active storage) |
| January | 0.14 | 3.0 |
| February | 0.13 | 4.0 |
| March | 0.20 | 6.0 |
| April | 0.41 | 0.0 |
| May | 0.64 | 0.0 |
| June | 0.72 | 0.0 |
| July | 0.87 | 0.0 |
| August | 0.73 | 13.0 |
| September | 0.50 | 12.0 |
| October | 0.39 | 10.0 |
| November | 0.20 | 2.0 |
| December | 0.13 | 5.0 |
The last consideration with the reservoir file was the non- project releases. Since no diversions were allowed to call upon any reservoir, this is the only way that a reservoir would release water from storage. To accommodate this occurrence, data regarding the amount of storage in Fontenelle Reservoir were reviewed over the ten year study period. A year was chosen in which Fontenelle completely filled and operated properly. The release volumes were then computed from this year's data by the difference in storage amount from month to month. Since WIRSOS wants the values in percent of active storage that is released, the dispensed amounts were then normalized by the total amount of active storage in Fontenelle reservoir. As with the evaporation rates, these values were also considered to be suitable for the rest of the reservoirs and assigned to them as well.
INSTREAM FLOW
Using the same acceptance criteria as the diversions, the
instream flow permits were examined. Only two permits were
adjudicated and fell within the basin. These two permits were
placed in the proper file utilizing the monthly adjudicated values.
DISCUSSION
Given these assumptions, a model was constructed that provides
a representation of the entire river system. The model should not
be used for a detailed analysis of any individual portion of the
basin. However, it does provide a starting point from which further
data can be added to make the model better predict what is actually
occurring at different points in the system. In addition, this
model renders the means to examine the effects of any large
modifications on the existing features of the Green River basin.
93-10 Table of Contents
Water Resources Publications List
Water Resources Data System Library |
Water Resources Data System Homepage