| |||||||||||||||||||||||||||||||||||
| |||||||||||||||||||||||||||||||||||
UNDERGROUND INJECTION WELL DATABASE DEVELOPMENT
FOR GROUNDWATER VULNERABILITY ASSESSMENT APPLICATIONS
| Jeffrey D. Hamerlinck | David R. Wrazien |
| Scott Needham | |
| 1993 | |
| Proceedings | WWRC-93-08 |
In
GIS/LIS '93
Proceedings, Volume 1
Minneapolis, MN
November 2-4, 1993
Submitted by
Jeffrey D. Hamerlinck
David R. Wrazien
Scott Needham
Wyoming Water Resources Center
University of Wyoming
Laramie, Wyoming
ABSTRACT
The Safe Drinking Water Act of 1974 established state Underground Injection Control (UIC) programs for regulating the subsurface emplacement of fluids through injection wells. This paper outlines the development of a GIS-based underground injection well database for the state of Wyoming, including: 1) methodology and techniques employed, 2) database design, and 3) creation of data analysis applications for groundwater vulnerability assessment. The primary purpose for developing this GIS database was to determine geographic locations for 6,700 injection wells in Wyoming to aid in assessing their potential as point sources of groundwater contamination. Database development required the integration of multiple data automation techniques, including map digitization and address geocoding. The database structural design includes a combination of "one-to-one" and "many-to-one" relational database components, incorporating the Environmental Protection Agency's newly established Minimum Set of Data Elements for Groundwater Quality, the UIC State Minimum Data Set and the Federal UIC Reporting System. Preliminary examples of groundwater vulnerability assessment applications being explored include an integration of the GIS with statewide groundwater sensitivity mapping efforts. The database will also be utilized for other state and local groundwater protection efforts in Wyoming, including wellhead protection programs and regulation of RCRA and Superfund sites.
INTRODUCTION
In 1988, the Underground Injection Control (UIC) Branch of the U.S. Environmental Protection Agency's (USEPA) Office of Drinking Water initiated a five-year effort to develop a, "national, decentralized UIC information system," (USEPA 1990; USEPA 1991a). Recent "minimum data set" guidance documents associated with the now established UIC Data Management System stipulate that all UIC regulatory agencies work toward establishing and maintaining a spatially- referenced digital database containing geographic coordinate location information for all UIC facilities. Prior to establishment of this mandate, location information for UIC facilities in Wyoming was only available in hardcopy format, and, to a limited extent, digital tabular files. In August 1992, the Wyoming Department of Environmental Quality (DEQ) contracted with the Wyoming Water Resources Center (WWRC) at the University of Wyoming to create an underground injection well geographic information system, (GIS) database for the Wyoming UIC Program. The primary purpose for developing the GIS database was to determine geographic locations for 6,700 injection wells in the state to aid in assessing their potential as point sources of groundwater contamination. This paper details the development of the GIS over a 12-month period from September 1992 through August 1993. Major topics addressed include: 1) methodology and techniques employed, 2) database design, and 3) development of data analysis applications for groundwater vulnerability assessment.
UNDERGROUND INJECTION REGULATION
The practice of underground injection has increasingly become essential to many of today's industries, ranging from the petroleum and chemical industries to geothermal energy development and a wide range of small local specialty plants and retail establishments (Osborne 1991). Responding to the realization that subsurface injection could contaminate groundwater, the Safe Drinking Water Act (SDWA) of 1974 established a federal Underground Injection Control (UIC) program for regulating the subsurface emplacement of fluids through injection wells. The goal of the federal regulations is to prevent contamination of Underground Sources of Drinking Water (USDWs). A USDW is defined as an aquifer or portion of an aquifer which: A) currently serves as a source of drinking water; or B) contains a sufficient quantity of ground water to supply a public water system or contains fewer than 16,000 mg/l total dissolved solid (unless exempted by special provisions of the SDWA) (Osborne 1991).
The USEPA has delegated primary regulatory authority to those states that have demonstrated an ability to implement UIC programs that meet USEPA requirements defined under Section 1422 or 1425 of the SDWA. All primacy requirements for UIC program regulation have been met in Wyoming. The state UIC program for Class II wells has been administered by the Oil and Gas Conservation Commission in Casper since 1982; the state UIC program for Class I, III, IV and V wells has been administered by the Water Quality Division of the Department of Environmental Quality (DEQ) in Cheyenne since 1983 (Western Water Consultants 1986).
As noted above and defined by UIC Program regulations, injection facilities are divided into five distinct categories, based on common design and operating technique. The principal factor distinguishing well classes is the type of activity and nature of associated injection fluids. A secondary factor used in the classification is the location of injection facilities relative to USDWs (Table 1).
The Class I injection well category includes over 450 active wells across the country, a third of which inject large volumes of hazardous fluids. Class II oil and gas production wells number approximately 175,000 in 31 states, most being involved in enhanced oil recovery activities. The Class III category includes approximately 30,000 wells at 200 facilities. Class IIIwells are primarily associated with solution mining of uranium (Osborne 1991). Twenty Class IV hazardous and radioactive waste wells existed in the United States as of 1989. The use of these injection wells has been banned by the USEPA (UIPC 1990b).
The largest class of injection wells includes the Class V "shallow injection" wells, with more than 300,000 facilities presently identified nationwide. This category includes all injection wells which do not fall under Classes I - IV. Class V injection practices recognized by the USEPA include 30 individual types of wells in seven major categories, ranging in complexity from simple cesspools to sophisticated geothermal reinjection wells. Not all Class V wells are used for disposal. "Examples of Class V practices which are not disposal related include Aquifer Recharge, Fossil Fuel Recovery and Mineral Recovery wells," (UIPC 1990b, 10).
| USEPA CLASSIFICATION |
INJECTION WELL CLASS DESCRIPTION |
| CLASS I | Wells used to inject liquid hazardous wastes or dispose of non-hazardous industrial and treated municipal wastewaters below the lowermost USDW. |
| CLASS II | Wells used to inject fluids associated with the production of oil and natural gas or fluids/compounds used for enhanced hydrocarbon recovery. These wells normally inject below the deepest USDW except in cases where a USDW also produces oil or gas. |
| CLASS III | Wells that inject fluids used for the extraction of minerals (e.g. uranium, sulfur and salt). |
| CLASS IV | Wells which dispose of hazardous or radioactive wastes into or above a USDW. These wells have been banned by the USEPA. |
| CLASS V | Wells not included in Classes I-IV, which generally inject nonhazardous fluid into or above a USDW. |
DATA ACQUISITION AND AUTOMATION
Data Acquisition
Data Collection. DEQ's existing UIC facility inventory served as the basis for
collecting injection well location data. This inventory had been maintained in a dBase III+
database file called FURS (Federal UIC Reporting System). Established in the early 1980s and
designed to correspond to USEPA's standard injection well inventory data sheet, the FURS
database includes individual records for each of the injection facilities located in the state.
Forty-one tabular fields contain data associated with the injection facilities. Including in the
database is information on facility permit IDs, facility names and locations, facility operators,
well class, well type and well status. Updated to September 1, 1992, DEQ's FURS database
contained records on 826 permitted facilities, representing over 6,700 individual Class I, III and
V injection wells (Table 2).
Using the FURS database as a reference, injection well location data was collected by accessing both active and archived UIC permit files. The location data provided in the UIC permit files was generally found to be in one or more of the following formats: permit application maps, township/range legal descriptions, subdivision block/lot locations or street address. Precision of available well location information varied considerably. When available, many permit maps provided highly precise and accurate locations of injection facilities. Other maps however, lacked geographic registration and/or an identifiable scale. Several township/range legal descriptions were encountered which failed to locate wells to the nearest quarter-quarter section. Similarly, a large number of subdivision descriptions were encountered which did not specify lot locations within a block.
| INJECTION WELL TYPE | PERMITTED FACILITIES | INJECTION WELLS |
| CLASS I | 16 | 24 |
| CLASS III | 9 | 5,281 |
| CLASS IV | 801 | 1,394 |
| Total: | 826 | 6,999 |
Permit documents were not available for approximately 30% of the permit records contained in the FURS database. It was determined that the majority of these facilities were Class V injection wells (shop repair bay floor drains and drainfield septic systems) which had been inventoried and added to the FURS database prior to 1986. At that time, Class V wells were authorized by rule, with no permitting requirements or restrictions (Council and Fryberger 1988). Consequently, the manner in which they were originally identified was not known, and in most cases, no follow-up work had been undertaken. As a result, the location information available for these facilities was limited to what could be determined from records in the FURS database. Given the recommended locational accuracy goal of 25 meters established by the USEPA Locational Accuracy Task Force (USEPA 1992b), these cases required that alternative resources be utilized in determining well locations for these facilities. In most cases, accuracy requirements in locating these wells were met by enlisting the assistance of county planners, engineers and assessors across the state. Provided with a list of facility names and street addresses and/or subdivision block/lot descriptions, these county officials were able to locate and plot on county plat maps, 90% of the wells with missing or inadequate permit documentation.
Location Mapping. Injection well locations for each county were plotted on one of two types of standard basemaps. In 20 of 23 counties, injection well locations were plotted on Bureau of Land Management (BLM) editions of U.S. Geological Survey (USGS) 1: 100,000- scale topographic maps (3Ox6O Minute Quadrangle Series). Mapped features used as locational references included Public Land Survey System linework, roads, surficial hydrography features and land ownership delineations. For most permits, individual injection wells were delineated and mapped as distinct point features. Permits for a number of facilities, however, contained a very large number of wells which could not be accurately located within the permitted area. For these cases, primarily involving mineral extraction, fossil fuel recovery and aquifer remediation activities, permit area boundaries were transferred to the basemaps and digitized as polygon features.
Subdivision plat maps were the' second type of basemaps employed in plotting injection well locations. These 1:6000-scale maps were utilized for plotting well locations on 20 individual square-mile township/range sections identified by DEQ as containing relatively dense concentrations of UIC facilities. This more detailed, large-scale mapping was carried out for the cities of Casper (Natrona County) and Gillette (Campbell County). The majority of the injection wells in these areas were repair shop floor drains or septic system drainfields located in subdivisions adjacent to the cities' corporate limits and sanitary sewer network. Monitor wells associated with the facilities in these areas were also located and plotted on the plat maps.
Spatial Data Automation
A combination of screen and tablet digitizing methods were utilized for automating injection
well locations plotted on the USGS and subdivision plat basemaps. Screen digitizing of well
location point features was carried out using a series of digital reference basemaps created with
ARC/INFO GIS software from 1990 U.S. Bureau of the Census TIGER/Line files (Bureau of
the Census 1991). Tablet digitization was used to create line and polygon coverages from the
20 subdivision plat maps described above. Injection facilities and monitor wells which had been
plotted on these maps were then digitized as point feature coverages in the GIS.
TIGER-based Digital Basemaps. The TIGER files were chosen as the basemap source over the 1:100,000-scale USGS Digital Line Graphs for several reasons. Both data sets contain elements which correspond closely to the transportation and surficial hydrography features found on the USGS 1: 100,000-scale maps, however, the TIGER files contain additional data which can be used in address matching procedures within the GIS. Furthermore, while the formats of both data types allow for relatively easy software-specific conversion (ESRI, Inc 1991b), the resulting TIGER-generated coverages are tiled by county, a method favored for the purposes of this project over the 30'x3O' latitude/longitude extent of converted DLG coverages.
Some concern was raised regarding the consistency of the TIGER files' spatial accuracy, since the files were developed from a combination of Census Bureau GBF/DIME files and USGS 1:100,000-scale data sets. It has been recognized that DLG data digitized from USGS 1:100,000-scale maps are more positionally accurate, since the linework must conform to National Map Accuracy Standards for data compiled at that scale. By comparison, no accuracy standards were imposed in the development of the GBF/DIME files, resulting in varied positional accuracy. On the other hand, many of the DLGS contain linework which has not been updated in 20 years, while the TIGER files have been enhanced to reflect recently expansion of built-up areas (Ji 1990). To compare the accuracy of TIGER and DLG linework in Wyoming, ARC/INFO line coverages were created from both datasets for three counties reflecting varying levels of transportation network development. Visual comparisons indicated, that in each county, the extent of linework was nearly identical for both coverages. In addition, the TIGER- generated coverages maintained comparable spatial accuracy to the coverages generated from the DLGS, confirming conclusions made by others that TIGER/Line files are suitable for county-based regional scale projects (Ferber 1991).
Address Geocoding. The 1990 Wyoming TIGER/Line files contain address range information for only two of the state's 23 counties, Natrona and Laramie. Because of the large number of injection wells located around the city of Casper in Natrona County, a decision was made to explore the viability of using address geocoding techniques to locate these facilities. Address geocoding routines in ARC/INFO provide a means of building a database relationship between addresses and coverage features. Addresses in an attribute data file are compared with coverages which have address attributes for each feature. When a match is found, geographic coordinates from the matched coverage feature are assigned to the attribute data file address. A new point coverage is also created containing the geographic location of each matched address, all associated attributes from the address file, as well as items needed to relate the address to the matching feature. Matches are determined by a scoring process based on user-defined matching criteria. Address comparisons must meet the minimum specified score in order for a match to be made. Provisions are also provided for evaluating and altering rejected addresses to achieve a match (ESRI 1991a).
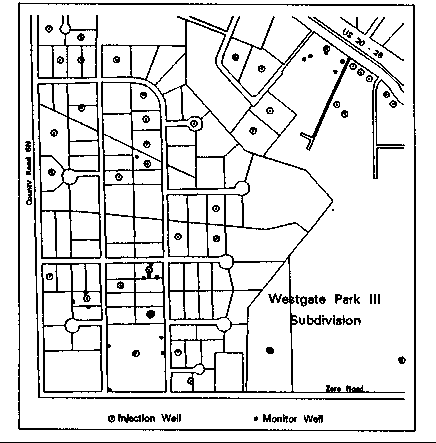
Figure 1. Detail of Large-Scale Underground Injection Well Map.
After converting the dbase III+ FURS database to an INFO data file, reselected addresses for facilities in Natrona County were compared with address ranges for arcs in the TIGER- generated Natrona County basemap line coverage. Overall, 168 of the 313 injection site addresses found in Natrona County were georeferenced. Of these locations, approximately 50% were deemed accurate to within 100 meters, based on comparisons with available permit file maps and prior knowledge of UIC Program staff at DEQ. This was comparable to results obtained in similar projects involving underground storage tanks, in which global positioning technology was used to verify positional accuracy (Terner 1991). Ten of the 38 injection facilities in Laramie County were matched. Positional accuracy similar to that achieved in Natrona County was observed during an individual field check of these wells.
Plat Map Digitization. Subdivision plat maps representing the 20 township/range sections were digitized at an input scale of 1:6000. Individual line and polygon coverages created for each section include section lines, roads, lot lines and subdivision boundaries. Individual injection well and monitor locations were then digitized as separate point feature coverages in the GIS. Figure 1 is a detail of a township/range section map showing the locations of injection and monitor wells.
DATABASE DESIGN
The structure of the GIS database is based on ARC/INFO's georelational vector data structure; spatial data, representing the point and line geometry of well locations and facility permit boundaries, is stored in an arc-node data structure, while attributes describing the spatial features are stored in a relational structure. Related well point feature attribute tables include a unique well identification number with associated latitude/longitude coordinate values. The related attributes for polygon features representing facility boundaries include a unique well identification number and Permit ID, which serve to describe all wells associated with the site. Redundancy of attribute data in the GIS was minimized by following standard normalization design principles and techniques for relational data structures (Waugh and Healey 1987; Brathwaite 1990). This was accomplished by establishing a series of "one-to-one" and "many- to-one" relates between the coverage feature attribute tables and three related attribute files.
No unique identifiers exist in the FURS database for individual wells represented by each of the permit records. Once imported into the GIS database, FURS was used to create a new database file, NEW_FURS, containing individual records and well identification numbers for all 6,700 injection wells in the state. These well identification numbers were the same numbers used as feature identifiers in the point and polygon coverage feature attribute tables. In this way, "one- to-one" relates were established between the coverage feature attribute tables and the NEW_FURS data file.
In addition to NEW_FURS, a second related data file was created, containing well-by-well information on the USEPA's Minimum Set of Data Elements for Groundwater Quality (MSDE). The USEPA has defined these elements as the basic data entities necessary to effectively use data from wells, springs and other ground water locations across ground water related programs. The MSDE are considered one measure in developing comprehensive state ground water protection programs (USEPA 1992a).
The MSDE data file created for the injection well GIS consists of 51 fields, representing the 21 data elements defined by the USEPA. Each record contains information for an individual injection well relative to its geographic location and use. Fields for unique well identification numbers provide for the establishment of "one-to-one" relates between coverage feature attribute tables and the MSDE data file. Data in the original FURS database can also be accessed from the MSDE data file using a "many-to-one" relate, keyed on the Permit ID field in each file. The MSDE database was also structured to conform to the USEPA's Facility Identification Data Standard and Locational Data Policy (1992b) and the Spatial Data Transfer Standard (Department of Commerce 1992).
A final consideration in the development of the MSDE data file and other elements of the GIS database was the need for consistency with the USEPA Underground Injection Control Branch's WATERS software (USEPA 199 lb). WATERS is a PC-based database system designed for tracking Class II injection wells. It contains well-specific data similar in nature to that contained in the FURS database for facility permitting, along with additional data regarding operational characteristics, inspections, mechanical integrity tests, enforcement actions and compliance status. Recent enhancements to the system include well schematic display capabilities and a GIS interface for querying and map display. While the current version of WATERS is designed only for Class II wells, consideration is being given to expanding the system to accommodate other well classes. For this reason, efforts will also made at making the structure of the GIS database compatible with WATERS, leaving open the opportunity for adopting WATERS well tracking capabilities.
GROUNDWATER VULNERABILITY ASSESSMENT APPLICATIONS
The development of an underground injection well GIS is greatly enhancing data management and analysis within Wyoming's UIC Program. In terms of data management, the GIS has the ability to provide comprehensive well-by-well tracking at the program implementation level. In addition to extensive map and report generating capabilities, the GIS will maintain a wide range of well-specific data including permitting well history, well location, inspections and operational characteristics. Potential analysis capabilities of the GIS include integrating the injection well GIS into statewide groundwater sensitivity mapping efforts.
Database Integration with Groundwater Sensitivity Mapping. The WWRC is currently creating a groundwater sensitivity map of Wyoming utilizing GIS technology. Groundwater sensitivity mapping spatially delineates the potential for ground water contamination from surface pollution sources. The sensitivity map being developed for the state adheres to the mapping and analysis techniques forwarded in the DRASTIC ground water vulnerability mapping procedure (Aller, et al., 1987). For the Wyoming effort six basic environmental mappable characteristics that influence surface contaminant transport into ground waters have been identified. These map coverages include (1) depth to ground water (first encountered), (2) net annual recharge, (3) soils, (4) land slope, (5) saturated hydraulic conductivity, and (6) the characterization of the hydrogeologic media.
A pilot sensitivity map has been completed for Goshen County in Eastern Wyoming. This preliminary project was to determine data and procedures to be employed in statewide mapping. In developing the groundwater sensitivity map, a set of unique relationships was generated relating environmental characterization to the sensitivity ratings based upon the influence of Wyoming's semi-arid natural environment on contaminant transport. The individual environmental sensitivity ratings for each of the six maps were then summed, resulting in an overall sensitivity rating. This final map represents the accumulative influence of each individual environmental characteristic.
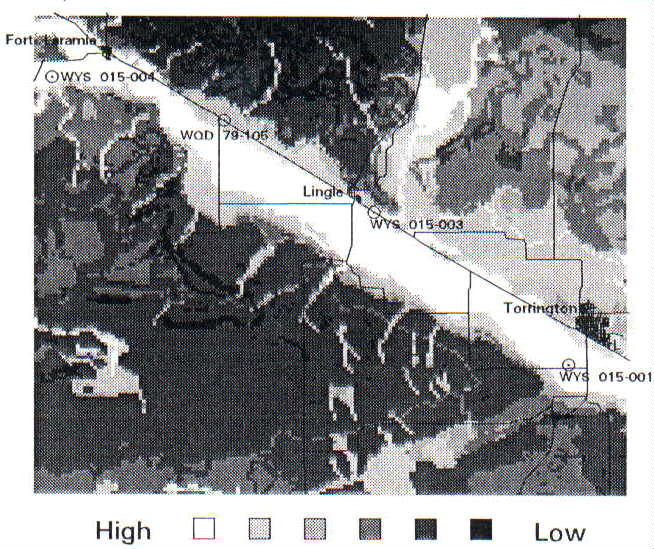
The primary purpose in producing the map is to guide the development of Wyoming's statewide pesticide management plan. However, the sensitivity map will also serve as a useful tool for other planning and management efforts concerned with ground water protection. Figure 2 is a detail of the groundwater sensitivity map created for Goshen County. Lightly shaded areas on the map represent areas most sensitive to groundwater contamination (In this instance, alluvial materials along the North Platte River). Overlayed on the sensitivity map are the locations of four Class V injection wells. The relative locations of these wells gives some indication of the vulnerability of these sensitive areas to contamination. This simple map overlay technique is just one example of the potential applications achievable by combining the two databases. Other applications currently being explored include Zone of Influence calculations and site-specific contamination potential determinations of shallow injection facilities.
Figure 2. Detail of Goshen County Groundwater Sensitivity Map and Underground Injection Well Locations.
Area of Review / Zone of Endangered Influence Calculations
Under UIC regulations, an Area of Review (AOR) is established for all permitted injection
facilities, within which the potential for contaminating USDWs is assessed. Depending upon the
class of injection well being permitted, the radius of the AOR may range between 1/4 and 2 1/2
miles (UICP 1990a). This area may be enlarged or reduced, based on a calculation of the "Zone
of Endangered Influence," the area surrounding an injection well or injection well pattern in
which the injection-induced pressure change in the injection zone is great enough to make
possible the migration of fluids out of the injection zone and into an underground source of
drinking water," (Engineering Enterprises, Inc 1985). Zone of Endangered Influence
calculations may be made using either a "Fixed Radius" method similar to that established for the
AOR, or a "Theis Calculation" method, based on reservoir conditions, injection pressures and
injectate parameters (UICP 1990a). Great potential exists for modeling Zone of Endangered
Influence scenarios within the GIS.
Class V Groundwater Contamination Potential Rating System
Developed in the mid-1980s, the objective of this system is to qualitatively assess the
consequences of Class V injection practices with regard to current or potential beneficial uses of
any USDW in communication with injection zones. The rating system utilizes four major
criteria parameters to assess each well type's contamination potential: 1) identification and
useability of the USDW; 2) typical construction, operation and maintenance procedures; 3)
chemical and physical characterization of injection fluid; and 4) typical injection volumes
(USEPA 1987). Options are currently being explored for automating the rating system within
the injection well GIS. Use of this technology could greatly increase efficiency in managing the
data required for the rating analysis, allowing for development of more detailed and quantitative,
site-specific assessments.
FUTURE DIRECTIONS
In addition to further refining the above mentioned data management and analysis applications, future potential developments associated with the injection well GIS include creation of an enhanced data dictionary within the database for increased data management efficiency, and the utilization of global positioning systems (GPS) technology to more accurately locate existing and new injection facilities. This technology will also be instrumental if the injection well database is expanded to include other point sources of groundwater contamination such as underground storage tanks. Finally, future efforts will address the need for a user-friendly, system interface, to ensure that the database is utilized to its fullest potential.
ACKNOWLEDGEMENTS
This project was made possible by a USEPA Office of Drinking Water grant administered by the Wyoming Department of Environmental Quality, Water Quality Division. The authors wish to recognize Robert Lucht, Wyoming UIC Program Supervisor, for his technical assistance throughout the duration of the project. Further appreciation is extended to WWRC GIS technicians Laisan Serebryakov, for assistance in data development, and Chris Arneson, for cartographic assistance in the preparation of this manuscript.
REFERENCES
Address Geocoding, ARC/INFO User's GUIDE 6.0, 1991a, Environmental Systems Research Institute, Inc, Redlands, CA.
Aller, L., et al., 1987, DRASTIC: A Standardized System for Evaluating Ground Water Pollution Potential Using Hydrogeologic Settings, U.S. Environmental Protection Agency, Cincinnati, OH.
An Introduction to the Underground Injection Control Program, 1990a, Underground Injection Practices Council, Oklahoma City, OK.
Brathwaite, K.S. 1990, The Database Environment: Concepts and Applications, van Norstrand Reinhold, New York.
Bureau of the Census, 1991, TIGER/Line Census Files, 1990, Technical Documentation, U.S. Department of Commerce, Washington, DC.
Council, L.C. and J.S. Fryberger, 1988, An Overview of Class V Injection Wells: in Proceedings, Underground Injection Practices Council 1988 Winter Meeting, Charleston, SC, pp. 45-72.
Data Conversion, ARC/INFO User's Guide 6.0, 1991b, Environmental Systems Research Institute, Inc, Redlands, CA.
Guidance Document for the Area of Review Requirement, 1985, Engineering Enterprises, Inc., Norman, OK.
Ferber, D. 1991, Tracking TIGER: The Use, Verification, and Updating of TIGER Data: in Proceedings, GIS/LIS '91, Atlanta, GA, pp. 230-239.
Injection Wells: An Introduction to Their Use, Operation and Regulation, 1990b. Underground Injection Practices Council, Oklahoma City, OK.
Ji, M, 1990, TIGER/Line Files and Their Potential for GIS Applications: in Proceedinps, GIS/LIS '90 , Anaheim, CA, pp. 117-124.
Osborne, P.S. 1991, Program Overview: Underground Injection Control - Region VIII, United States Environmental Protection Agency, Denver, CO.
Terner, M. 1991, The Use of TIGER Data, Global Positioning Satellite (GPS) Technology, and ARC/INFO Address Matching Capability to Construct an Initial Underground Storage tank (UST) Database: in Proceedings, Eleventh Annual ESRI User Conference, Volume 2, Palm Springs, CA.
U.S. Environmental Protection Agency, 1992a, Definitions for the Minimum Set of Data Elements for Ground Water Quality, Office of Water, Washington, DC.
_________________, 1992b, Locational Data Policy Implementation Guidance - Guide to the Policy, Office of Information Resources Management, Washington, DC.
_________________, 1991a. Release of WATERS Version 1.0, Office of Water Memorandum, Washington, DC.
_________________, 1987, Report to Congress, Class V Injection Wells, Office of Water, Washington, DC.
Spatial Data Transfer Standard, 1992, U.S. Department of Commerce, Washington, DC.
_________________, 1990, UIC Data Management System State Minimum Data Set for Class II Wells; Guidance #68, Office of Water Memorandum, Washington, DC.
_________________, 1991b, WATERS Users Guide, Version 1.0, Office of Water, Washington, DC.
Waugh, T.C. and R.G. Healey, 1987, A Relational Data Base Approach to Geographical Data Handling: International Journal of Geographical Information Systems, 1(2), pp. 101-118.
Western Water Consultants, Inc. 1986, Assessment of Class V Injection Wells in the State of Wyoming, Wyoming Department of Environmental Quality/Water Quality Division, Cheyenne, WY.
Copyright 1993 by the American Congress on Surveying and Mapping, the American Society for Photogrammetry and Remote Sensing, AM/FM International, the Association of American Geographers, and the Urban and Regional Information Systems Association. All rights reserved. ISBN-0-944426-99-9/93/2 + .10.
Water Resources Publications List
Water Resources Data System Library |
Water Resources Data System Homepage