| |||||||||||||||||||||||||||||||||||
| |||||||||||||||||||||||||||||||||||
Greg L. Kerr
Victor R. Hasfurther
| 1989 | WWRC-89- 12 |
Wyoming Water Research Center
University of Wyoming
Laramie, Wyoming
Final Report
Submitted to
Wyoming State Engineer's Office
Cheyenne, Wyoming
In 1982 Casper-Alcova Irrigation District (CAID), the City of Casper, and the U.S. Bureau of Reclamation (USBR) entered into an agreement by which the City of Casper would be able to purchase water from the CAID for municipal purposes. Water available to the City of Casper could only come from water conserved by the CAID through improvements to their conveyance system. CAID agreed to develop a System Improvement Program to conserve 7000 acre-feet of water per year which would be available to the City. Funds provided by the City would then by used to improve areas of the canal and laterals for greater water conveyance efficiency.
Following CAID's agreement with the City of Casper and the USBR with technical assistance from the U.S. Soil Conservation Service (SCS), a long range plan was developed to identify water loss areas. Laterals were ranked as to their potential for loss. Eight laterals were given priority for study because they were predicted as having relatively high losses. These eight laterals included 210, 218, 256, 102, 57, 128, and 128-17. Field investigations were initiated to obtain data for estimating water loss and for recommending subsequent improvements to areas of the canal and specific laterals.
In April 1987, the Wyoming Water Research Center received a request from the Board of Control (State Engineer's Office) for assistance with a problem area in the Casper Alcova Irrigation District-City of Casper System Improvement Program. This problem area included a segment of lower lateral 256 (Figure 1). Described as lying within Sections 7 and 18 in Township 34 North, Range 81 West and Sections 8 and 17 in Township 34 North, Range 80 West. There are four sublaterals within the 6,592 ft. canal study area; 256-50R, 256-50L, 256-52R, and 256-55R. The segment had been studied for four years previous with inconclusive results as to the amount of water lost from the system (CAID-City of Casper, System Improvement Program, 1986 Progress Report). Water Center staff met with Leslie Horsch of the CAID to obtain information about the problem area and to see how the Water Center could assist with acquiring representative data on lateral 256.
Figure 1. Lower lateral 256 study area with recording installations.
* Original map from (CAID-City of Casper, System Improvement Program, 1986
Progress Report).
Review of Previous Work on Lateral 256
In reviewing the study area, with CAID personnel, several problems seemed to exist with trying to obtain reasonable data from lateral 256. A fluctuating control at Recorder 256-R70 was the main reason that accurate data could not be obtained. Adjustments for water users above the R70 recording area were causing fluctuations at the R70 recording site. Water below R70 entered a culvert which restricted the flow at this point causing backwater effects above this area (culvert to R70). Attempts to develop a rating curve for this site (R70) under both fluctuating water level conditions and backwater effects proved to be unfeasible (inconclusive data). The depth of the water in lateral 256 also caused concern in that it was often difficult, if not impossible, for CAID personnel to wade in order to take discharge measurements. With the canal and other lateral areas being studied, concerns were also expressed that CAID lacked the personnel time and an adequate number of recording devices to expend totally on lateral 256. Without accurate information at the R70 recording site, reasonable calculations for possible losses throughout the lateral could not be achieved. However, from measured flow records, estimates for 1984, 1985 and 1986 were calculated by extrapolating the average daily loss over the irrigation season. Seasonal losses on lower lateral 256 reported for 1984 equaled 1,174 acre-feet, for 1985 equaled 1,197 acre-feet and 603 acre-feet for 1986 (CAID-City of Casper, System Improvement Program, 1986 Progress Report).
Objectives
After reviewing the difficulties that CAID personnel encountered in
working with lateral 256, Water Center staff discussed several objectives to try
and acquire accurate data from this section of lateral.
The three main objectives of the study were:
Field Reconnaissance
Empty Lateral
Two separate field inspections of lateral 256 were taken, one before water was released into the lateral and a second when the lateral was flowing with water.
The first visit to the site (May 11, 1987) with the canal dry indicated various problems and gave insights on measuring devices. First, the culvert below R-70 was indicated as restricting flow and causing backwater by CAID.
Lower on lateral 256 at 50R sublateral, two diversions at the same location with measuring devices were present. These included a ten-inch pipe with a flow meter installed and a Parshall flume. The flow meter appeared to be inoperable because the view cover was missing, the dial indicator was corroded and rusted, and with the pipe being dry the meter was indicating a flow reading of approximately 500 gpm. It was recommended that the meter be removed, repaired and recalibrated with the Water Center absorbing the cost. The second measuring device was a Parshall flume installed in a separate sublateral turnout next to the pipeline. The approach into the flume was lined with concrete to seal and set the flume. However, the concrete was formed in a way that the concrete covered a portion of the mouth above the flume bottom and angled across and up the sides of the flume. The effect of this partial obstruction on measurement accuracy is not known, but without a smooth transition into the mouth of the flume it is likely that inaccuracies exist. Also, the bottom of the ditch at the outlet of the flume appeared to be high enough to possibly prevent free flow to occur through the flume.
Directly across from sublateral 50R is the turnout for sublateral 50L, this sublateral withdraws the largest amount of water from the study section on the lower portion of lateral 256. The measuring device installed at this sublateral consists of a V-box liner designed to accept a Pendvane flowmeter. The sides at the entrance to the V-box were washed out which would allow flow to move around the device. CAID has plans to seal around the box with concrete before any water is turned into the ditch. An F-l water stage recorder was also installed at this location. This measuring site and instrumentation appeared to be in good shape for monitoring sublateral 50L if the wash out is corrected (it was).
Sublateral 52R was in question as to whether it would be used for irrigation during the 1987 season because of a change in land ownership. Problems noted by CAID personnel from the past included trying to find a suitable section of ditch to measure the flow. The ditch did not have enough gradient to measure the flow until the water left a small stock water pond some 200 yds below the turnout from the main lateral. At this point avoiding backwater effects would depend upon how the irigator dispersed his water onto the field. A V-box liner design to accept a Pendvane flowmeter was installed at this site. This was an acceptable installation as long as the back water effects from below by the irrigator could be controlled.
The last turnout from the study section of lateral 256 was sublateral 55R. CAID personnel noted that even though this sublateral was seldom turned on it still had a small amount of seepage (continuous) flow during the irrigation season. A rectangular weir was installed at this location along with an F-l water stage recorder and staff gage. This appeared to be an adequate measuring installation.
Below the turnout for sublateral 55R is cross section R80 which is the end of the study section for lateral 256. At this point CAID personnel had a cross section established for measurement of discharge, this site included a stilling well installation with an F-l water stage recorder and a staff gage in the canal. This installation appeared to be in good condition for monitoring representative data. The only problem encountered by CAID personnel with this section in the past was with wading the canal to obtain discharge measurements under high water levels. The section had a small bridge installed to help with this problem.
Full Lateral
Upon release of water into lateral 256, a second field inspection of the study site was made to identify any problem areas with the system flowing and also to make decisions on the final procedures to be used for investigation. The area of R70 was looked at with definite possibilities of backwater, it was decided to move upstream in the lateral as far as possible and set up a cross-section for monitoring discharge. A temporary stilling well with Fl recorder and a staff gage would be set up at this point. By being as far away from the culvert as possible it was hoped that the largest percentage of backwater would be eliminated. Sublateral 50R was looked at again with a determination that the flow meter installation in the ten inch pipe would have to be repaired before any reliable measurements were taken. Previous attempts to have the meter removed for service before water was released were met with reluctance. With the pipe flowing full of water, the meter was still registering approximately 500 gpm, the same as when the pipe was dry. The flume at this location would receive a temporary stilling well with Fl recorder and the accuracy of the flume would be checked with a portable flow meter.
Sublateral 50L did not appear to have any problems, the Pendvane would be used along with checking measurements with a portable flow meter. The cross section for discharge measurements would be moved from CAID's established site downstream of the V-box in order to utilize a more uniform channel section. The current recorder installation would be used, but gears for time and stage would be changed in order to be consistent with other installations.
The new land owner at sublateral 52R would be utilizing water during the season; therefore a temporary stilling well with Fl recorder would be installed along with the Pendvane. Discharge measurements would be taken with a portable flow meter for a check on the Pendvane. The landowner would have to be worked with during test periods in order to control backwater effects from diversion dams placed in the ditch. The final turnout, sublateral 55R, had a minimal flow in the ditch which could not be accurately measured with the permanent flume installation, therefore a portable one-inch flume would be installed for discharge determination. The permanent recorder installation would be used with the time and stage gears again changed to be consistent with other installations.
Cross-section R80 would be used as the last monitoring site on lateral 256. The Fl recorder would have the gears changed to match other recording devices on the study section. Also, at this site it was noted that trash collected on the center pier of the drop structure. With the recording instrument approximately ten yards above this structure, even a small amount of trash can cause backwater effects and therefore give false readings on the recorder and when taking flow measurements. This area should be kept clean at all times during test periods.
Test Procedures
Upon inspection of the study area with the canal full of water, final testing procedures were established. It was decided that two, one-week periods of measuring on the study reach would provide adequate data to determine if water losses were occurring. During these individual test periods each turnout and recorder site on the lateral would be measured as many times as possible with an electronic flow meter using standard USGS procedures to develop a stage discharge relationship. Discharge measurements would start at the upper end of the study section, at a newly established measuring site R70WC, and then proceed downstream to the next measuring point. When reaching the last measuring site at R80, measurements would be initiated again at the upper site R70WC. Recorders would be installed at the measuring sites that did not previously have a recorder installation and these would be checked during each discharge measurement period. Pendvanes would also be read as a check where installed on sublaterals.
CAID representatives were contacted to schedule the first test period. Concerns were expressed by Water Center personnel as to the status of the flow meter in the ten-inch pipe at 50R. It was indicated that there was reluctance on the part of the landowner to have the meter repaired. CAID personnel also indicated that they had checked the meter again and that it was operating correctly. The landowner utilizing sublateral 50R indicated that he would have the water shut off for at least ten days while he was harvesting his alfalfa. With this shutoff period available, it was decided to conduct tests during that time frame. Therefore, there would be no need to monitor the two turnouts at sublateral 50R which would eliminate any questionable need for repairs on the pipe flowmeter, and also eliminate the need to check the flume accuracy at this site for the study.
Field Studies
Plans to conduct studies when sublateral 50R was shut down were implemented and Water Center personnel scheduled with CAID to begin field installations. Recording instrument installations and setup of cross sections for measurement of discharge began on July 14, 1988. Full measurements began on all recording areas on July 15, and continued through July 18 for the first test period (Table 1). The second test period began on July 21 and continued through July 25 (Table 1).
Data Analysis
With the field data collected, rating tables for all recording sections were developed. Using the rating tables and the continuous water stage records for all measurement sites, water that was measured at the top of lateral 256 at R70WC was followed through the study section. By calculating the average velocity at the top site and measuring the distance between each turnout and recording point, the travel time was calculated throughout the study section. Total distance from the top monitoring point R70WC to the bottom monitoring point R80 was determined to be 7590 feet. Discharge at each measuring site for the corresponding adjusted travel time when flow arrived was obtained from the continuous recording charts. These resulting discharge figures for individual monitoring sites are listed in Table II for test period one and test period two. Fluctuations occurring at the upper end of the study section would not affect flow that had already proceeded downstream.
Discharge values for the two test periods at the top monitoring point R70WC were compared with the discharge values from the bottom monitoring point at R80. A plot comparing the measured discharges from R70WC to the measured discharges from R80WC for the two test periods is shown in Figure 2. Also plotted in Figure 2 is the calculated discharge, which is obtained by subtracting the withdrawals at sublaterals 256-50L, 256-52R and 256-55R from the discharge at the top monitoring point R70WC. This calculated discharge is the amount of water that should arrive at R80 after all withdrawals are taken out of the lateral if no gains or losses occur in the reach. Table III is a listing of calculated discharge figures at R80 compared with the actual measured discharge figures at R80 for the two test periods. Also listed in Table III is the corresponding loss or gain at R80 after subtracting the calculated discharge from the actual measured discharge for the same time period.
Table I. Monitoring sites and data collected during the study.
--------------------------------------------------------------------------

                    First Test Period
- Top of section R70WC - continuous stage record, seven discharge
  measurements, discharge measurement times documented.

- Sublateral 50R - water shutoff during test period.

- Sublateral 50L - continuous stage record, seven discharge
  measurements, seven Pendvane readings, discharge measurement times
  documented.

- Sublateral 52R - continuous stage record, seven discharge
  measurements, seven Pendvane readings, discharge measurement times
  documented.

- Sublateral 55R - continuous stage record, portable flume check,
  discharge measurement times documented.

                    Second Test Period
- Top of section R70WC - continuous stage record, nine discharge
  measurements, discharge measurement times documented.

- Sublateral 50R - water shutoff during test period.

- Sublateral 50L - continuous stage record, nine discharge measurements,
  nine Pendvane readings, discharge measurement times documented.

- Sublateral 52R - continuous stage record, nine discharge measurements,
  nine Pendvane readings, discharge measurement times documented.

- Sublateral 55R - continuous stage record, portable flume check,
  discharge measurement times documented.
--------------------------------------------------------------------------------
* Locations are indicated on map in Figure 1


Table II.  Discharge values for test periods one and two at
           monitoring points throughout lateral 256 study
           section (in cfs).
-------------------------------------------------------------------------
Date                                Station
	     256-R70WC     256-50L      256-52R   256-R76    256-R80
-------------------------------------------------------------------------
FIRST TEST PERIOD
7-15-87		52.66	     6.66 	   1.11	    .07	       52.00
7-16-87		43.48	    11.27	    .94     .07	       40.98
		37.58	    11.10	    .87	    .07	       34.94
7-17-87	        37.58	    11.27	    .84	    .07	       37.37
		40.27	    12.18	    .89	    .07	       38.89
7-18-87		44.31	    12.37	    .91	    .07	       41.51
		45.57	    12.37	    .87	    .07	       42.60

SECOND TEST PERIOD
7-21-87	        43.89	    12.18	    .87	    .07	       40.98
		45.15	    12.18	    .89	    .07	       40.45
7-22-87		43.07	    12.37	    .87	    .07	       39.41
		42.26	    12.37	    .82	    .07	       36.39
7-23-87		36.09	    11.81	    .73	    .07	       32.62
		35.36	    11.27           .73	    .07        32.62
7-24-87		42.66	     7.06	    .84	    .07	       39.93
		38.33	     8.19	    .69     .07        29.98
------------------------------------------------------------------------
In all cases throughout the two test periods a gain in discharge occurred at the lower end of the lateral 256 study section. The average gain for the measured points during the two test periods combined was 8.6 CFS.
The area irrigated by sub-lateral 256-50L was observed as having a ponded area at the southwest corner of the field adjacent to lateral 256. The gradient of the ground surface in this area appeared to slope in a southwesterly direction toward lateral 256. Intermittent discharge measurements before the turnout to 256-50L indicate that the gains in discharge in lateral 256 occurred after the 256-50L turnout. This indicates that water from sublateral 256-50L used to irrigate crops in the field adjacent to lateral 256 is most likely contributing sub-surface return flow to the lateral.
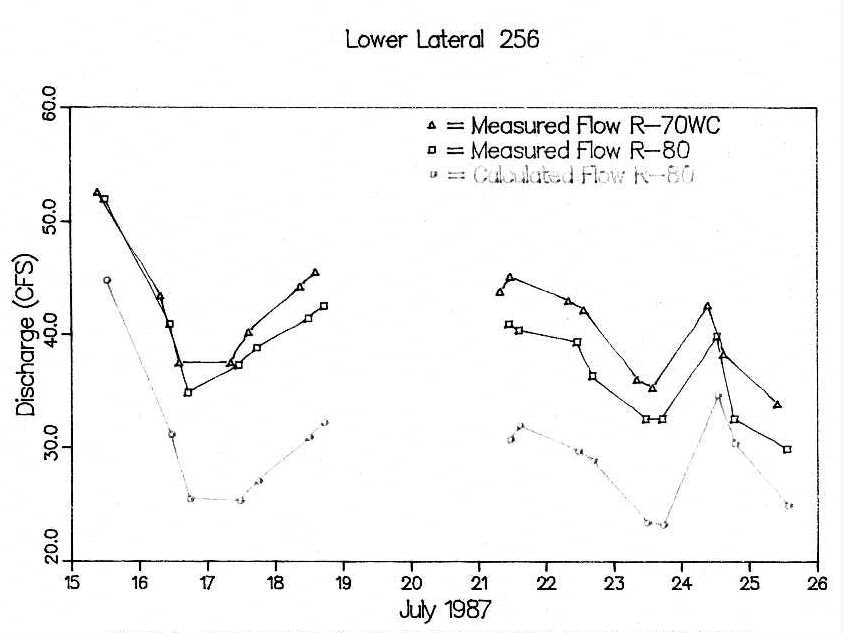
Figure 2. Plot comparing measured flows at the R70WC (upper) and R80 (lower)
monitoring sites
along with the calculated flow after all withdrawals are
subtracted from the R70WC (upper) site.
Table III.  Measured discharge, calculated discharge and the
corresponding gain or loss at the R80 recording site.
---------------------------------------------------------------
	      R80	        R80
Date	   Calculated	     Measured		Gain/Loss
            Discharge	     Discharge		 +    -
             (cfs)	      (cfs)               (cfs)
---------------------------------------------------------------
7-15	     44.82		52.66		 +   7.18
7-16	     31.20		43.48		 +   9.78
	     25.54              37.58            +   9.40
7-17	     25.40		37.58            +  11.97
             27.13	   	40.27		 +  11.76
7-18	     30.96		44.31		 +  10.55
	     32.26		45.57		 +  10.34
7-21	     30.77		43.89		 +  10.21
             32.01		45.15		 +   8.44
7-22	     29.76		43.07		 +   9.65
             29.00		42.26		 +   7.39
7-23	     23.48		36.09		 +   9.14
             23.29		35.36		 +   9.33
7-24	     34.69		42.66		 +   5.24
	     30.45		38.33		 +   2.17
7-25	     24.98		33.93		 +   5.00
---------------------------------------------------------------
Groundwater Wells
Groundwater wells were installed parallel to lateral 256 on the east side of the canal by CAID in 1986 to monitor seepage losses from the canal to the adjacent areas (Figure 3). Eighteen wells spaced approximately 200 feet apart and 150 feet from the center of the lateral were established along the east side of the main lateral from R70WC to approximately 800 feet below the drop structure at R72. Two wells were established on the west side of the canal approximately 100 feet from the center of the lateral, the first approximately 150 feet above the drop structure at R72 and the second approximately 550 feet below the drop structure. Neither of these wells had continuous recorders installed but hand measurements were taken by CAID personnel throughout the irrigation season. Records of groundwater elevations measured in the wells versus surface water elevations in the main lateral were provided to the Water Center after the irrigation season was completed. Because the Water Center did not work directly with these wells, only an overview will be provided here to explain the relationship of the wells to lateral 256.
Figure 3. Groundwater monitoring well locations on lower lateral 256.
(Contours are area evleavation differences.)
When comparing the water surface elevation in the wells located above the drop structure at R72 with the water surface elevation of the canal, a general trend seems to exist as indicated below. Upon release of water in the canal on May 10 and its continual rise to a full condition, the wells show a corresponding rise. As the canal water surface rises, water levels in the wells also rise and then reach a relatively steady level after the canal reaches its full state. At this steady level, the water surface elevations in the wells are lower than the water surface elevation in the canal. The canal water seems to initially be charging the subsurface region adjacent to the canal as the canal is filled, but then the system appears to reach an equilibrium. This equilibrium is maintained throughout the irrigation season until the water in the canal is shut off. At that time, water flows from the area of the wells back into the canal system. Figures 4 and 5 are representative examples of the general trends shown by plotting the data obtained from the canal water surface elevation and the well water surface elevation from two of the fourteen wells above drop structure R72. The B.N. well (Figure 6) located above the drop structure on the west side of the canal also followed the same trend as the wells on the east side of the canal above drop structure R72. The same rise in well level follows the canal water surface upon release of water into the canal, followed by a leveling out during the irrigation season and a drop in well level following shut off of water in the canal in late September. With monitoring wells located parallel and close to the lateral, it is not possible to determine what influence the canal water has on the subsurface at greater distances from the lateral.
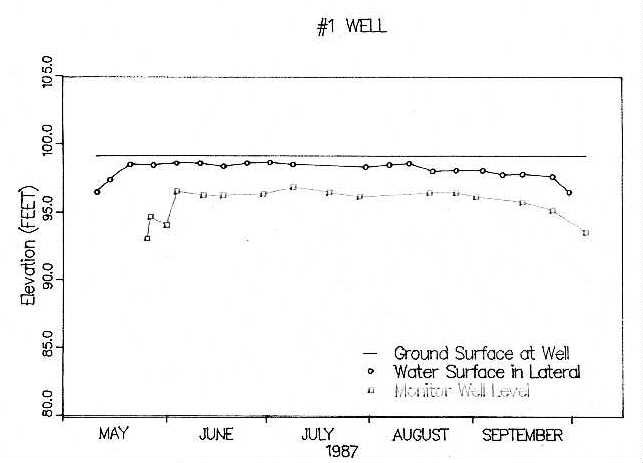
Figure 4. Monitoring well #1 compared to the water surface in lateral
256 at the upper end of the study section.
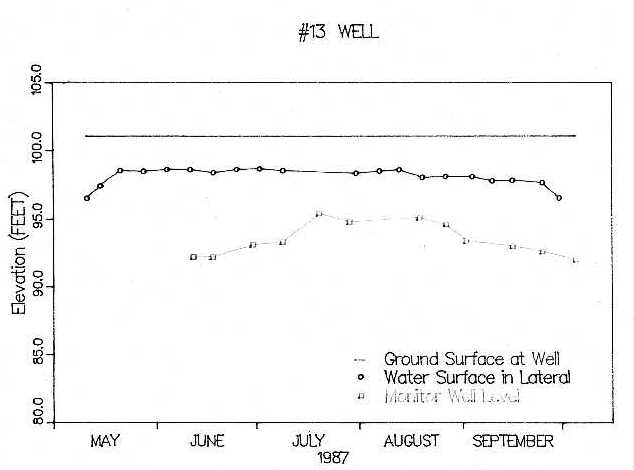
Figure 5. Monitoring well #13 compared to the water surface in lateral
256 directly above the R72 recording site.
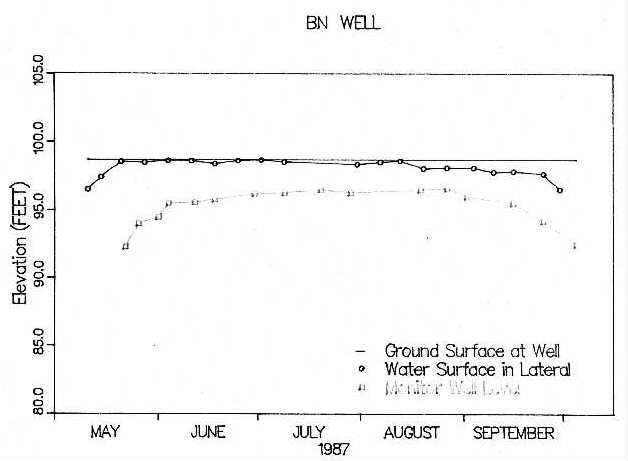
Figure 6. Monitoring well BN on the west side of the lateral compared to
the water
surface in lateral 256 above the drop structure near the R72
recording site.
Observation wells 15, 16, 17, 18 and BS located below the turnout for sub-lateral 50L show a different relationship with respect to the lateral surface water elevations above the drop structure at R72. Figure 7 shows observation well #15 water elevation compared to the surface water elevation in the lateral below the drop structure. The well water elevation after release of water into the lateral rises above the elevation of the water surface in the lateral and remains there through July, August and part of September until water in the lateral was shut off. This same general trend is also seen in well 16 (Figure 8). In wells 17, B.S., and 18 (Figures 9-11) the water levels are below, but remain close to, the water surface elevation in the lateral except for one measurement in well 17 on August 27 which is above the elevation in the lateral. With the area below the drop structure at R72 appearing to have the largest amount of gain in the study section of lateral 256, indicated from tests during the study period, it would appear that the difference in head between the water surface above the drop and that below the drop is a major cause of inflow (gain) back to the lateral. A profile comparing the well water elevations with the surface water elevations in the lateral, above and below the drop structure, is shown in Figure 12. The head differential resulting from the drop structure, coupled with the high water table from irrigation below and adjacent to the drop structure together, take advantage of the seepage face available along the banks of the lateral below R72 caused by the drop structure. Subsurface return flow appears to occur in this area.
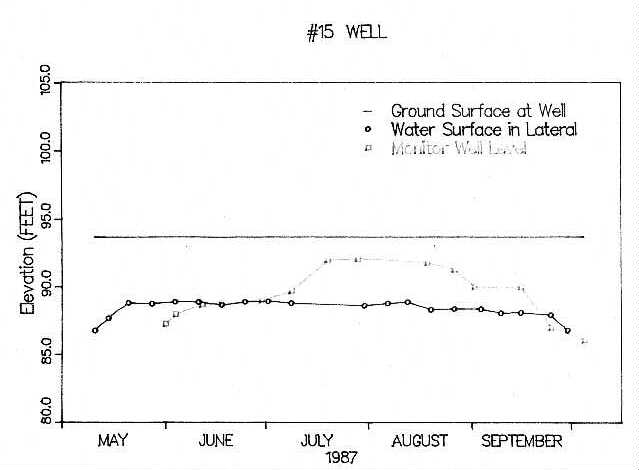
Figure 7. Monitoring well #15 directly below recorder site R72
compared to
the water surface in lateral 256 below the drop structure.
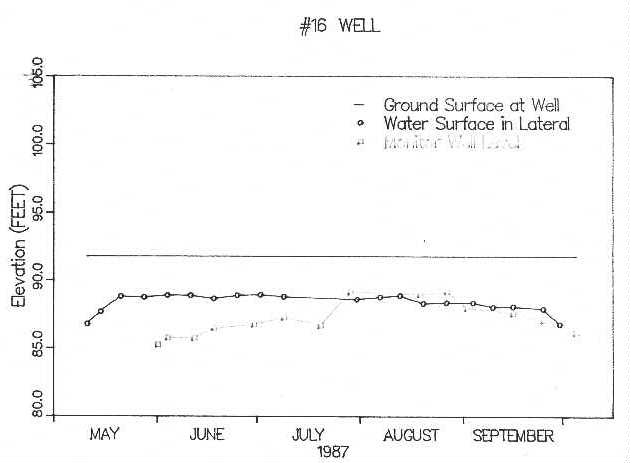
Figure 8. Monitoring well #16 compared to the water surface in lateral
256 below the drop structure.
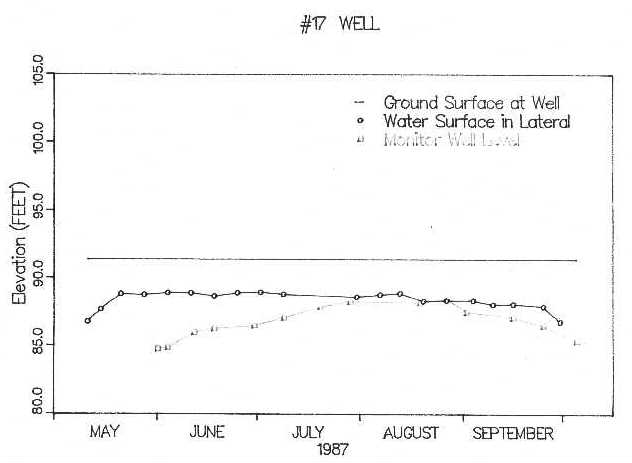
Figure 9. Monitoring well #17 compared to the water surface in lateral
256 below the drop structure.
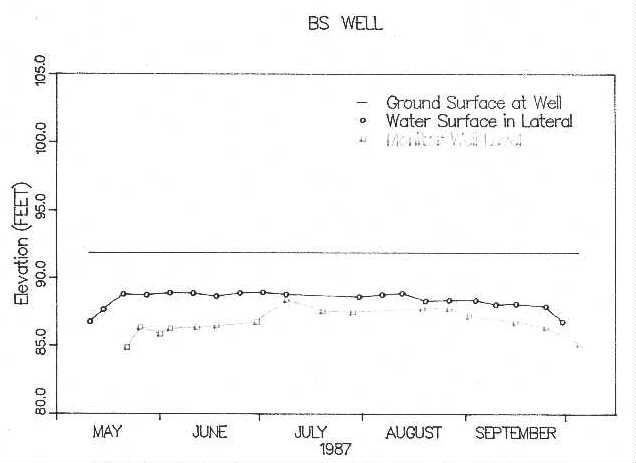
Figure 10. Monitoring well BS compared to the water surface in
lateral
256 below the drop structure on the west side of the lateral.
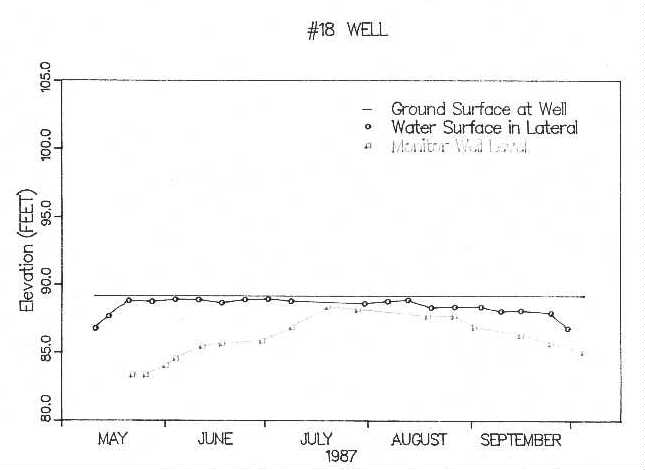
Figure 11. Monitoring well #18 compared to the water surface in lateral
256 below the drop structure.
Conclusions
During two test periods from July 14, 1988 through July 18, 1988 and July 21, 1988 through July 25, 1988, the lower lateral 256 of the Casper Alcova Irrigation District canal system was studied to determine any loss or gain attributable to this section. Through continuous stage records and numerous discharge measurements throughout this section of lateral 256 it was determined that a substantial amount of water diverted for irrigation does return to the lateral system in the lower end of the study section. The points measured during the first test period indicated an average discharge for withdrawals from the lower lateral 256 equal to 12.02 CFS. An average of 10.14 CFS or 84 percent was returned through seepage back into the lower end of the system. During the second test period an average withdrawal discharge for the points measured indicated 11.37 CFS. An average discharge of 7.40 CFS or 65 percent was returned through seepage back into the system. Measurements throughout the study section indicated that gains back to the lateral occur below the drop structure R72 measuring site. Well levels below the R72 area indicate higher elevations than the water surface in the lateral directly below the drop structure.
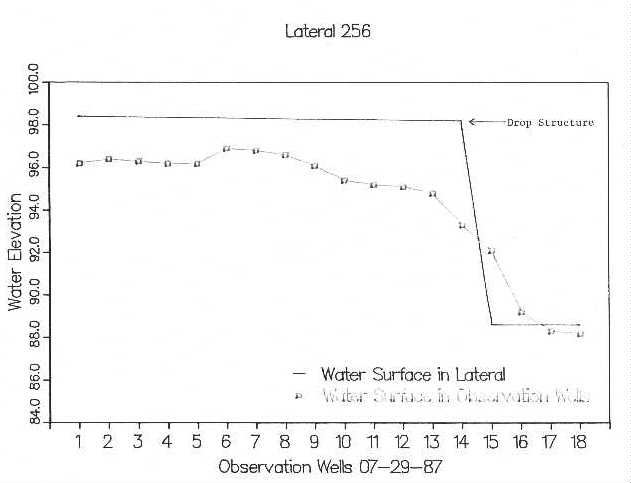
Figure 12. Profile comparing lateral 256 water surface elevations with
well water elevations.
Recommendations
Review of lower lateral 256 by Water Center personnel before any testing was initiated indicated several areas of the monitoring system that contribute to error which could be improved upon. The following suggestions could possibly improve the quality of the data collected and also cut down on total time involved in obtaining data for determining losses or gains. Hopefully, this information could be used not only in lateral 256 but also in other areas of the total canal system.
The following list of suggestions is the result of problems that were seen during the field visits to the lateral 256 study site.
References
Brakensiek, D.L., H.B. Osborn and W.J. Rawls. 1979. Field Manual for Research in Agricultural Hydrology. Agriculture Handbook No. 224, U.S. Department of Agriculture.
Rantz, S.E. 1982. Measurement and Computation of Streamflow: Volumes 1 and 2, U.S. Geological Survey, Water Supply Paper 2175.
Horsch, L.K. 1987. Progress Report, 1986 Hydrologic Investigations, CAID-City of Casper, System Improvement Program.
Casper-Alcova Irrigation District, City of Casper, Wyoming, U.S. Bureau of Reclamation, Soil Conservation Service. February 1983. CAID- City of Casper 1983 System Improvement Program.
Water Resources Publications List
Water Resources Data System Library |
Water Resources Data System Homepage