| |||||||||||||||||||||||||||||||||||
| |||||||||||||||||||||||||||||||||||
                      LITTLE HORSE CREEK CONVEYANCE
                               LOSS STUDY

                              Greg L. Kerr
                          Victor R. Hasfurther
                             Steve A. Mizell

                1987                              WWRC-87-18


                      Wyoming Water Research Center
                          University of Wyoming
                            Laramie, Wyoming


                              Final Report

                              Submitted to

                     Wyoming State Engineer's Office
                            Cheyenne, Wyoming
Contents of this publication have been reviewed only for editorial
and grammatical correctness, not for technical accuracy. The material
presented herein resulted from objective research sponsored by the
Wyoming Water Research Center, however views presented reflect neither a
consensus of opinion nor the views and policies of the Water Research
Center or the University of Wyoming. Explicit findings and implicit
interpretations of this document are the sole responsibility of the
author(s).
                            TABLE OF CONTENTS
                                                                   Page
Study Location  . . . . . . . . . . . . . . . . . . . . . . .         1
Review of Previous Study  . . . . . . . . . . . . . . . . . .         2
Alternatives to Previous Study  . . . . . . . . . . . . . . .         3
Instrumentation and Data Collection . . . . . . . . . . . . .         4
Geology . . . . . . . . . . . . . . . . . . . . . . . . . . .         7
Springs . . . . . . . . . . . . . . . . . . . . . . . . . . .         9
Hydrograph Plots  . . . . . . . . . . . . . . . . . . . . . .        12
Conveyance Loss   . . . . . . . . . . . . . . . . . . . . . .        26
Dye Study . . . . . . . . . . . . . . . . . . . . . . . . . .        28
Conclusions . . . . . . . . . . . . . . . . . . . . . . . . .        29
References  . . . . . . . . . . . . . . . . . . . . . . . . .        32

                             LIST OF TABLES

TABLE                                                              Page
I.    Gaging Sites and Instrumentation . . . . . . . . . . . .        5
II.   Average Flow Comparing Gain or Loss Between
      Gaging Stations  . . . . . . . . . . . . . . . . . . . .       18
III.  Average Flow Before and After First Release  . . . . . .       26
IV.   Average Flow Before and After Second Release . . . . . .       27


                             LIST OF FIGURES

Figure                                                             Page
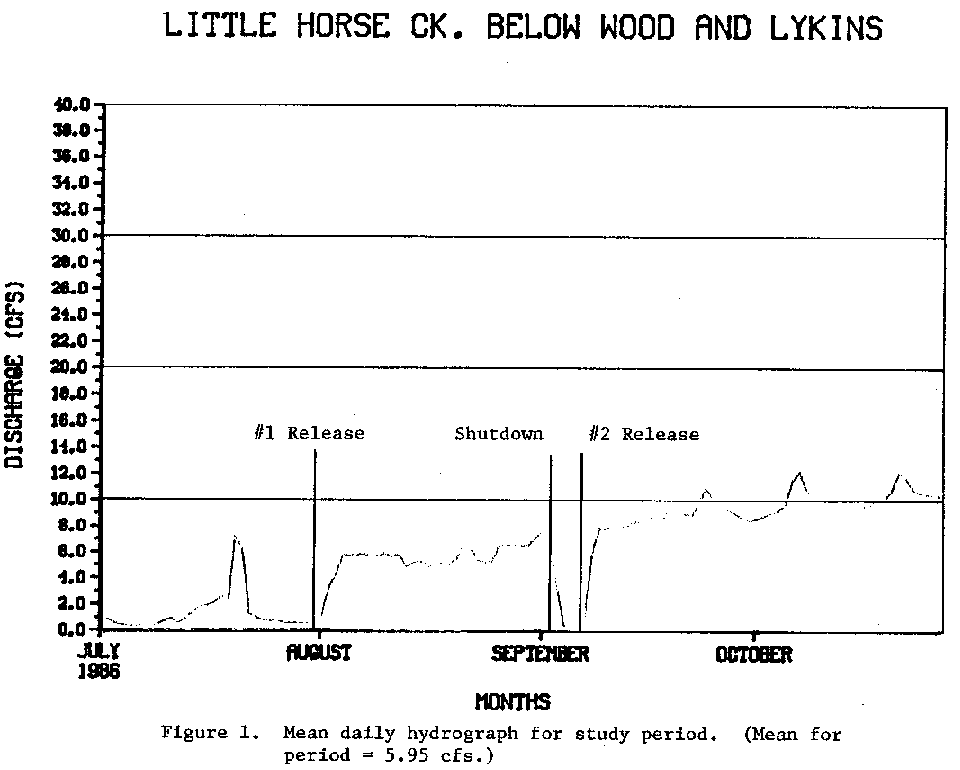
1.  Mean daily hydrograph, Little Horse Creek
       below Wood and Lykins . . . . . . . . . . . . . . . . .       13

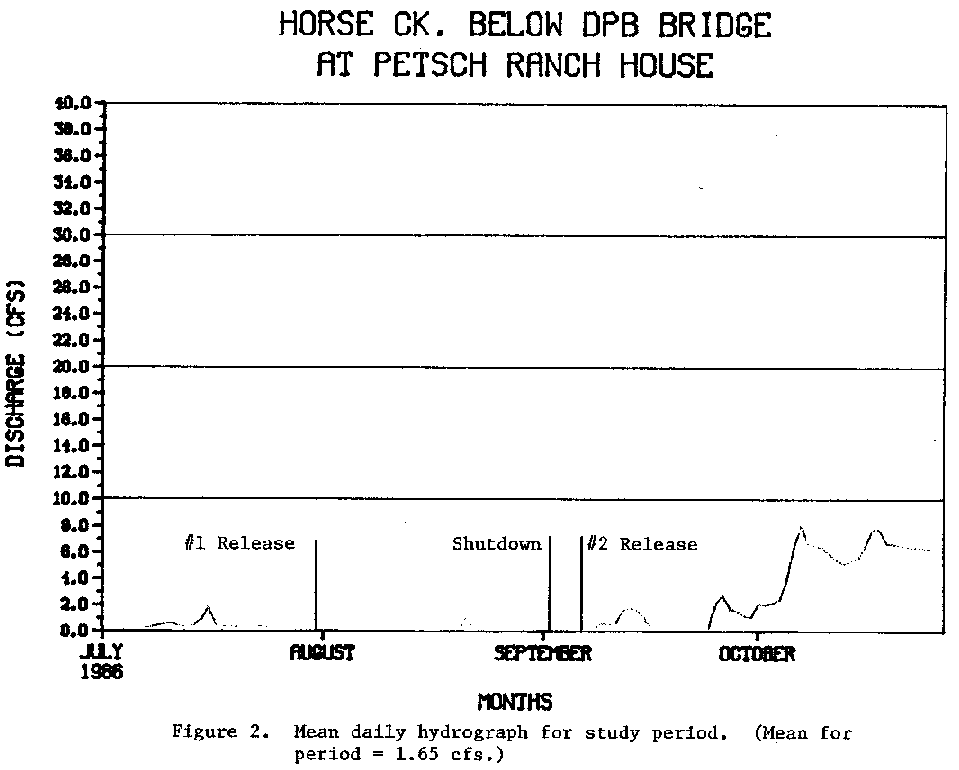
2.  Mean daily hydrograph, Horse Creek below
       DPB Bridge at Petsch Ranch House  . . . . . . . . . . .       14

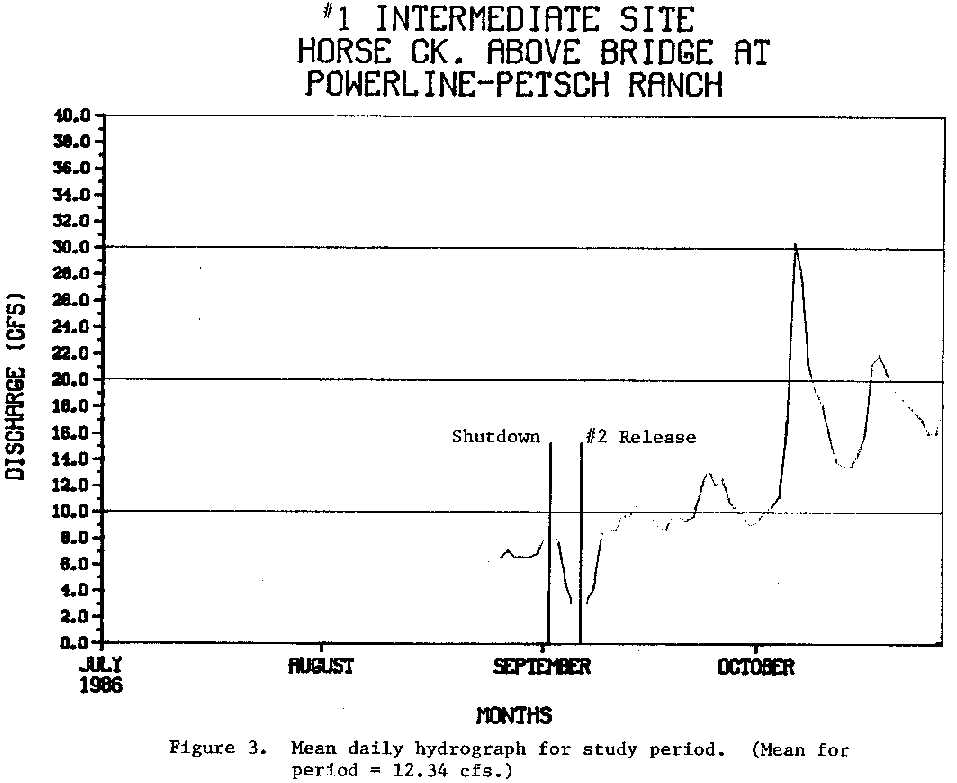
3.  Mean daily hydrograph, #l Intermediate Site,
       Horse Creek above Bridge at Powerline-Petsch Ranch  . .       15

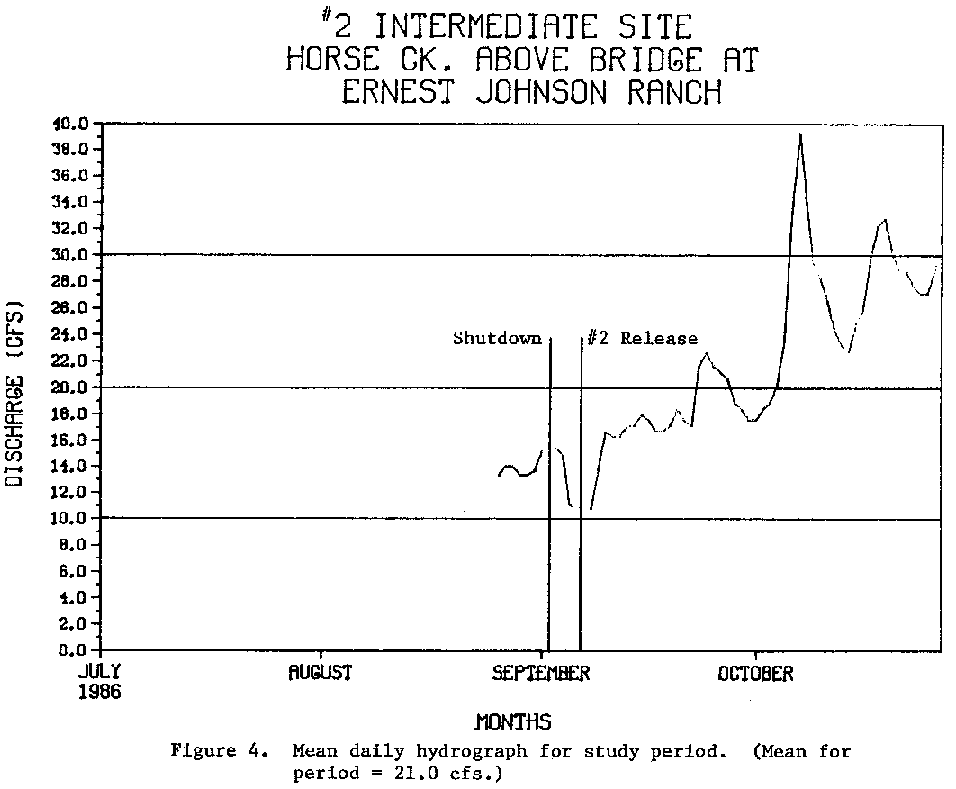
4.  Mean daily hydrograph, #2 Intermediate Site,
       Horse Creek above Bridge at Ernest Johnson Ranch  . . .       16

5.  Mean dally hydrograph, Horse Creek at Brown and
       LaGrange Ditch  . . . . . . . . . . . . . . . . . . . .       17

6.  Comparison of mean daily hydrographs upstream to
       downstream. Horse Creek at Brown and LaGrange
       Ditch v. Horse Creek at DPB Bridge and Little Horse
       Creek below Wood and Lykins . . . . . . . . . . . . . .       20

7.  Detailed section of mean dally hydrograph comparing
       Little Horse Creek and DPB bridge gages to Brown and
       LaGrange during release . . . . . . . . . . . . . . . .       23

8.  Detailed section of mean dally hydrograph comparing
       Little Horse Creek and DPB bridge gages to Brown and
       LaGrange gage during test shutdown  . . . . . . . . . .       24

9.  Detailed section of mean dally hydrograph comparing
       Little Horse Creek and DPB bridge gage during second
       release . . . . . . . . . . . . . . . . . . . . . . . .       25

10.  Dye test from the Wood and Lykins Diversion on Little
       Horse Creek to the Brown and LaGrange Ditch on Horse
       Creek . . . . . . . . . . . . . . . . . . . . . . . . .       30
In June of 1986 the Wyoming Water Research Center entered into an
agreement with the Wyoming State Engineer's Office to assist in the
collection of field data, analysis and presentation of a summary and
recommendation concerning the stream channel conveyance losses on Little
Horse Creek and Horse Creek near and upstream of LaGrange, Wyoming.
The necessity of this study was to provide information that would assist the State Engineer's Office and the Board of Control in determining if a futile call for regulation of water exists on the Springvale and Wood and Lykins diversions on Little Horse Creek for the Brown and LaGrange diversion downstream on Horse Creek. The three main objectives of the study were to:
Study Location
This study was conducted in northeastern Laramie County and south-
eastern Goshen County. The study reach begins on Little Horse Creek at
the Wood and Lykins diversion on the Hunter Ranch (S16-T18N-R62W) and
continues 26 miles downstream on Little Horse Creek-Horse Creek to the
Brown and LaGrange diversion on the Johnson Ranch (S14-T19N-R61W). A
map of the study area is contained in Appendix I.
Little Horse Creek to its confluence with Horse Creek and Horse Creek are meandering perennial streams with well defined channels In the 26 stream mile study reach. Large cottonwood trees are especially prominent along the stream banks in the first several miles downstream from the Wood and Lykins diversion on Little Horse Creek-Horse Creek. The entire reach is also covered with thick vegetation and shrubs and in certain areas this vegetation overhangs the banks.
Review of Previous Study
A previous study conducted for the period June 21, 1985 through
July 22, 1985 by Mr. James Ward, Hydrographer-Commissioner Division I,
District 2, and H.L. "Toby" Miskimins, Commissioner Division I, District
1 was reviewed. In this study attempts were made to monitor precipi-
tation in the area and relate this to the stream flow in Horse Creek.
Existing measuring devices at the Wood and Lykins diversion and the
Brown and LaGrange diversion were used to determine the discharge at
these points. Readings were taken from a 4' Cipoletti weir at the Wood
and Lykins diversion and from a 4' Parshall flume in the Brown and
LaGrange ditch during the study period. Flows in Horse Creek just below
U.S. Highway 85 above the confluence of Little Horse Creek were
estimated by visual observation. Precipitation gages were installed and
checked when precipitation events occurred in the area. Current meter
measurements were taken four times during the study period, twice at the
Brown and LaGrange ditch on 7-11-85 and 7-18-85 and twice on Horse Creek
(S18-T18N-R61W) on 7-18-85 and 7-22-85. Notes on the Brown and LaGrange
4' flume Indicate that it was either partially or totally submerged
during the latter part of the month-long study period.
Data from the 1985 study, according to the Board of Control, appeared to be Inadequate for them to make qualified judgments concerning regulation of Little Horse Creek for the Brown and LaGrange diversion.
Alternatives to Previous Study Upon making a preliminary field reconnaissance of the study area and reviewing methods from the 1985 study. Water Center personnel discussed various problems that may have caused results of the previous study to be Inadequate. Several alternatives were discussed to alleviate these problems In order to achieve more accurate data;
Instrumentation and Data Collection
On June 24, 1986, work efforts were begun to establish cross
sections on the stream study reach and install temporary gaging
stations. These stations were installed to obtain baseline information
prior to any testing efforts and secondly to monitor time and discharge
amounts throughout the study reach during the study period.
Continuous streamflow recorders were Installed Initially at three locations (Table 1). These included: 1) Little Horse Creek below the Wood and Lykins diversion; 2) Horse Creek at the DPB bridge just above the confluence with Little Horse Creek near the Irvin Petsch ranch house; and 3) the Brown and LaGrange diversion on Horse Creek above the town of LaGrange.
                                               TABLE I

                                  Gaging Sites and Instrumentation
____________________________________________________________________________________________________________
____________________________________________________________________________________________________________

________________________________________________LOCATION__________ELEVATION____________INSTRUMENTS__________

 Little Horse Creek below                    S16-T18N-R62W          4910           -Continuous Recorder
 Wood & Lykins Diversion                                                           -12" Parshall Flume
____________________________________________________________________________________________________________

 Horse Creek at DPB Bridge                   S15-T18N-R62W          4876           -Continuous Recorder
 below Petsch Ranch House                                                          -9" Parshall Flume
____________________________________________________________________________________________________________

 #1 Intermediate site: Horse Creek           S18-T18N-R61W          4779           -Continuous Recorder
 above bridge at Powerline-Petsch Ranch*                                           -Staff Gage
____________________________________________________________________________________________________________

 #1 Intermediate site: Horse Creek           S1-T18N-R61W           4672           -Continuous Recorder
 above bridge at Ernest Johnson Ranch*                                             -Staff Gage
____________________________________________________________________________________________________________

 Horse Creek at Brown & LaGrange             S14-T19N-R61W          4600           -Continuous Recorder
 Diversion                                                                         -Staff Gage
____________________________________________________________________________________________________________
____________________________________________________________________________________________________________
*Locations are indicated on map in Appendix I
Little Horse Creek below the Wood and Lykins diversion also
received a 3" Parshall flume installation temporarily (to monitor low
flows) until a 12" Parshall flume was acquired and installed for the
remainder of the study period (to monitor higher flows). A 9" Parshall
flume was installed in Horse Creek at the DPB bridge In order to
accurately account for flows at this point.
Prior to flume installations on Little Horse Creek below the Wood and Lykins diversion and on Horse Creek at the DPB bridge, discharge measurements were taken once per week with a Marsh McBirney electronic portable flow meter or a Price pygmy meter. These measurements were taken to obtain baseline discharge information and to rate the channel. After installation of the flumes, streamflow recorders at the Wood and Lykins diversion and at the DPB bridge were both set to record stream stage based on the flume staff gages. Upon initial regulation on Little Horse Creek, the 4' Cipolletti weir was installed at the Wood and Lykins diversion to compare flow readings with the 12" Parshall flume at this location. After completion of the study, flow readings were analyzed between the weir and flume. Flow readings were an average of 6 percent lower from the Cipolletti weir than from the Parshall flume. The largest difference is seen when comparing the highest flow values. The highest flow from the Parshall flume was 7.79 cfs compared to 7.12 cfs for the same time, or 9 percent less from the Cipolletti weir. The recorder on the Brown and LaGrange ditch was set to a staff gage installed in the ditch and a new rating curve was developed on the ditch in order to avoid recording information from the completely submerged 4' Parshall flume.
Two intermediate gaging sites on Horse Creek (Table I) and the Brown and LaGrange gaging site were also measured once per week with the portable current meters until the call for regulation of Little Horse Creek was put into effect. At that time, measurement intervals were increased to twice per week in order to obtain additional points for development of the rating curves.
Two additional continuous streamflow recorders were installed later during the study period, to facilitate time of travel measurements, at the two intermediate sites on Horse Creek. These included the #l Intermediate site, located approximately 9.3 miles downstream of the Wood and Lykins diversion, and #2 Intermediate site, located at the Ernest Johnson Ranch approximately 20.1 miles downstream of the Wood and Lykins diversion.
Small tributary streams and springs were also monitored along the 26-mile reach of Horse Creek throughout the test period. This was done with the use of a portable 3" Parshall flume, or by visual observation when flume measurements were not feasible.
Geology
Dockery (1940), Babcock and Rapp (1952), Lowry and Crist (1967) and
Love and Christiansen (1985) have produced geologic maps that encompass
the study area in northeastern Laramie County. Though each of the
mapping efforts exhibit differences in detail, all describe the same
regional geology. The three formations identified In this area are the
White River Formation, the Arikaree Formation, and alluvial deposits
along the stream channels.
The White River Formation is of Oligocene Age. It may be as much as 500 feet thick. In Laramie County, composition of the White River Formation is remarkably uniform, consisting of massive brittle argillaceous siltstone with some beds of sandstone, conglomerate and volcanic ash. Extensive fractures in the formation often cause weathered outcrops to appear as assemblages of loose blocks (Lowry and Crist, 1967).
In nearby areas the White River Formation has been elevated to group rank and divided into the Chadron and Brule Formations (Lowry and Crist, 1967). Love and Christiansen (1985) adopt this ranking and identify the Brule Formation in northeastern Laramie County while previous authors had identified this same formation as the undifferentiated White River Formation. On weathering, the Brule frequently develops the appearance of blocks and slaps and may form miniature badlands locally (Babcock and Rapp, 1952). Both the blocky texture and badland topography were observed in the vicinity of the old Davis Ranch (S9-T18N-R61W).
The Arikaree Formation is observed on ridges to the south of the study reach. It encircles the southern extent of the Goshen Hole area in northeast Laramie County and southeast Goshen County (Love and Christiansen, 1985; Lowry and Crist, 1967; Babcock and Rapp, 1952). In eastern Laramie County, the Arikaree Formation is described as being a loosely to moderately cemented fine-grained sandstone. Within this formation, thin layers of hard, tough sandstone and tightly cemented gravel lenses may be seen (Babcock and Rapp, 1952). Babcock and Rapp (1952) are the only workers in this area who have mapped the Arikaree Formation on ridges within the southern rim of the Goshen Hole.
Alluvial deposits are generally restricted to narrow bands, usually less than a quarter-mile wide, along the channels of Horse Creek and Little Horse Creek. As these drainages flow further into the Goshen Hole, the alluvial deposits become more extensive, up to five miles wide north of LaGrange. In the LaGrange area, these deposits may be 19 to 45 feet thick, but outside the Goshen Hole along stream channels, alluvial thickness is unknown. Along western portions of Horse Creek, alluvial deposits consist mainly of coarse sand, gravel, cobbles and boulders derived directly from the Laramie Range. To the east, alluvial deposits along Horse Creek contain more fine-grained materials derived mainly from the Brule and Arikaree Formations and reworked alluvial deposits (Babcock and Rapp, 1952).
Springs
A reconnaissance trip along approximately seven miles of Horse
Creek channel was taken to locate contributing springs. This reach of
Horse Creek is south of LaGrange in Sections 1, 2, 11, 10, 15, 9, 16 of
T18N-R61W. At the time of this reconnaissance, six springs were noted.
These specific springs do not appear to be recorded in the geologic/
hydrologic literature covering the area. However, other workers have
reported springs outside this area in the Brule Formation and at the
contact between the Brule and Arikaree Formations (Dockery, 1940;
Babcock and Rapp, 1952).
In the Brule Formation, springs occur along bedding joints, usually on valley wall outcrops. Thin volcanic ash claystone layers in the Brule Formation are impervious causing water to move laterally through more permeable overlying material (Dockery, 1940). Springs in the Brule may also occur in areas where fissures have developed (Babcock and Rapp, 1952). Springs associated with the Arikaree Formation generally occur at the contact with the Brule Formation. These springs are typically small and the water infiltrates within a short distance (Babcock and Rapp, 1952).
The six springs observed along this reach of Horse Creek can be divided into two groups based on the nature of their occurrence. The first group of springs are those which occur in surface tributary channels. Included in this group are springs in Bushnell Creek (Sec. 11), Kellehan Creek (Sec. 16) and Bills Spring, a local name, which may be contained In the Stinking Water Creek channel (Sec. 1). Ellis Spring is the largest of these springs flowing 1.46 cfs. It surfaces in a bog area and then flows about one-half mile before entering Horse Creek. Though not confirmed in conversation with local residents or by field observation, topographic maps suggest that Bills Spring may rise in the ephemeral channel of Stinking Water Creek. The sink/spring relationship at Bushnell Creek was clearly recognized in the field reconnaissance. The creek infiltrated in a wide sandy swale. From there, water flows underground for about 200 yards before surfacing in deep, heavily vegetated pools. At the point where it surfaces, water is about 300 yards south of Horse Creek. Bushnell discharges approximately .35 cfs into Horse Creek. The spring at Kellehan Creek is contained within high walls of the stream channel. The point at which water completely infiltrates was not observed. However, the spring clearly surfaces in the bottom of the deep channel and flows about 200 yards where it discharges approximately .2 cfs into Horse Creek.
Another small tributary spring which was measured separately from those mentioned previously was located approximately 6 miles below the Wood and Lykins diversion In S24-T18N-R62W. It flowed through a marsh area and contributed approximately .18 cfs to Horse Creek on a continuous basis for the entire study period.
The second group of springs discharge from large surface areas on the hillslope next to the creek or from the sides of high cut banks along Horse Creek. One small spring discharges about one-half mile east of Horse Creek along a hillside located at the Johnson Ranch east of Horse Creek in SI-T18N-R61W. It discharges from the hillside into a small pond from which .58 cfs is released into Horse Creek. Two sets of springs discharging from high cut banks are located immediately downstream of Kellehan Creek (Sec. 16) and about 1.5 miles further downstream in Section 10. Neither of these sets of springs appear to be associated with significant tributaries. In the area downstream of Kellehan Creek, spring discharge occurs at four or five points. Where definite flows can be observed, they average a flow of approximately .1-.15 cfs. These seeps are about three feet above the inside flood- plain of Horse Creek and 10 to 12 feet below the upland surface. This area is on the south bank of Horse Creek. As observed elsewhere by Dockery (1940), these springs may be associated with bedding joints in the Brule Formation. The second set of springs covers an area approximately 70 yards by 5 yards on the north bank of Horse Creek in the south central portion of S10-T18N-R61W. Throughout most of this area there is no clear point of discharge. Instead soil on the hillside grades continuously from being damp to being soggy. Where water was free flowing into Horse Creek it was estimated at approximately .3 cfs.
In the southwest corner of S10-T18N-R61W, there also appears to be a vegetative difference on the lower two-thirds of the hillside that is associated with seepage. From across the valley this seep area appears to be associated with a band of greener vegetation that trails off from the uplands which are irrigated from the Rutledge and Helman ditch. The ground surface in this area is moist compared to surrounding areas. This association may indicate the origin of the seep water, but a connection was not directly established.
Hydrograph Plots
The three continuous recorders at Wood and Lykins, DPB bridge and
Brown and LaGrange ditch were in operation from June 25, 1986 to October
27, 1986. Continuous recorders at the #l Intermediate gaging site and
at the #2 Intermediate gaging site were operational from August 26, 1986
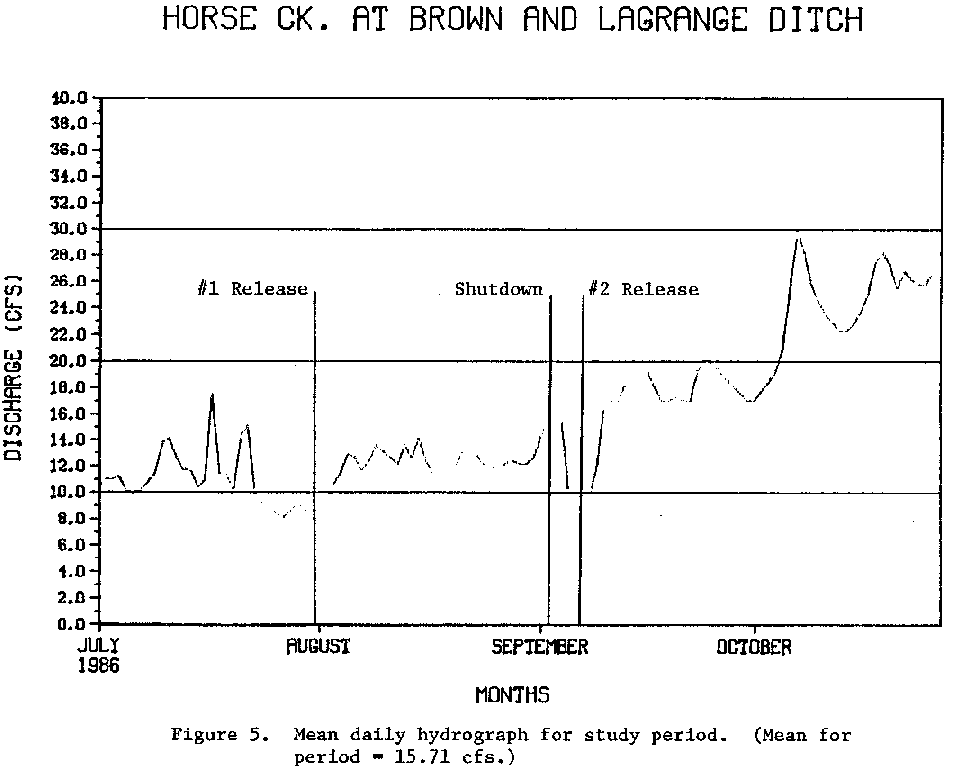
to October 27, 1986. Hydrographs of average dally flow for each
individual station during the period of record are shown in Figures 1
through 5. Specific points are indicated where regulation of Little
Horse Creek at the Wood and Lykins diversion was initiated.
|
|
|
|
|
|
                                 TABLE II
                   Average Flow Comparing Gain or Loss
                          Between Gaging Stations
_________________________________________________________________________

                   Period August 26-September 30, 1986

     Combined Wood and Lykins and Horse Creek        =  7.9 cfs
        at DPB Bridge

     #1 Intermediate site-Horse Creek above          =  8.5 cfs
        bridge at powerline

     #2 Intermediate site-Horse Creek above          = 16.2 cfs
        bridge at Ernest Johnson Ranch


     Horse Creek at Brown and LaGrange               = 15.7 cfs
     Diversion
__________________________________________________________________________
The gains along the study reach can be attributed to the spring and
seep areas identified earlier. Measured flows above ground in this area
do not equal the total amount of gain for the reach which indicates that
contributions from other unidentified groundwater is significant (at
least 4 cfs). The loss occurring between the #2 Intermediate site and
the Brown and LaGrange diversion could possibly be due to two large
center pivot systems pumping from the groundwater in S13 and
S24-T19-R61W.
Figure 6 gives a comparison of average daily flow at the upper end of the study reach with average daily flow at the lower end. The upper end values are achieved by adding Little Horse Creek below the Wood and Lykins diversion and Horse Creek below the DPB bridge. Lower end values are those recorded in the Brown and LaGrange ditch which diverts all of the flow In Horse Creek at this point.
Three specific areas of importance are indicated In Figure 6. These include:
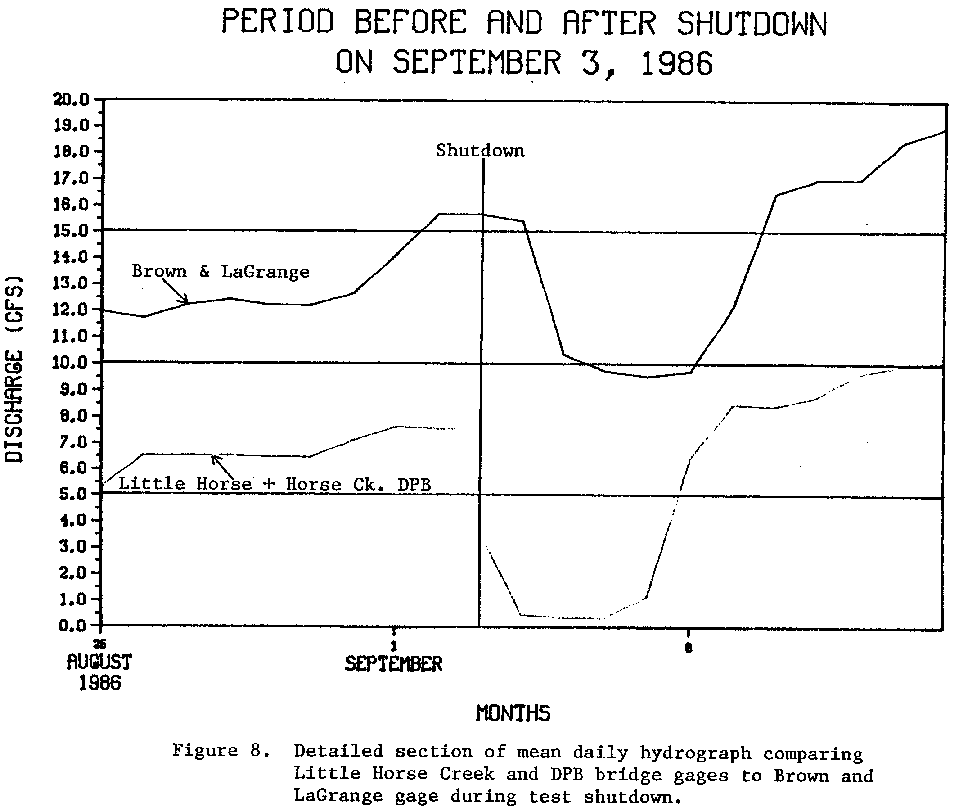
Regulation of the Springvale and Wood and Lykins diversion was initiated on August 1, 1986. The Wood and Lykins diversion was shut down at 11:15 a.m. and the Springvale diversion was shut down at 11:30 a.m. Total flow In Little Horse Creek continued until September 3, 1986 at which time a test was performed to see if shutting off flow in Little Horse Creek would consistently affect flow in the Brown and LaGrange ditch. Total flow in Little Horse Creek was diverted into the Wood and Lykins ditch at 1:15 p.m. on September 3, and continued to be diverted until 11:45 a.m. on September 7, when total flow was released back into Little Horse Creek.
The general trends between the two plots in Figure 6 indicate that when flows from the Wood and Lykins ditch and the Springvale ditch are diverted back Into Little Horse Creek, an increase in the flow at the Brown and LaGrange ditch is also observed. The opposite is also true upon diverting total flow out of Little Horse Creek, a drop in flow is observed in the Brown and LaGrange ditch. Upon release of water on August 1 into Little Horse Creek, it took approximately 3.5 days before a rise and stabilization was observed at the Brown and LaGrange diversion. Comparing this time period to the shutdown of flow in Little Horse Creek on September 3, the lag time for a drop In stage at the Brown and LaGrange diversion was approximately 2 days. When again releasing flow on September 7 Into Little Horse Creek, a lag time of 2.5 days was observed.
The difference in time periods can be attributed to several conditions; first of all, flow from the Springvale ditch was diverted back into Little Horse Creek at approximately the same time as flow from the Wood and Lykins ditch. A time lag of approximately 24 hours exists between the Springvale and Wood and Lykins diversions, therefore the flow entering Horse Creek would come in two stages approximately 24 hours apart and with less velocity than if the two were combined. As a result, flow at the Brown and LaGrange ditch would reflect this time lag and slower velocity. Secondly, when shutting down flow on September 3, all flow In Little Horse Creek ended abruptly because total flow was diverted into the Wood and Lykins ditch. Total flow in Horse Creek was higher at this time, reflecting higher velocities, therefore a shorter time lag should have existed. When releasing flows again on September 7, total flow In Little Horse Creek was available because only the Wood and Lykins ditch had to be diverted thereby eliminating the time lag from the Springvale ditch. This later date also reflects higher total flows In Horse Creek and higher velocities contributing to the shorter time period for water from the Wood and Lykins to reach the Brown and LaGrange.
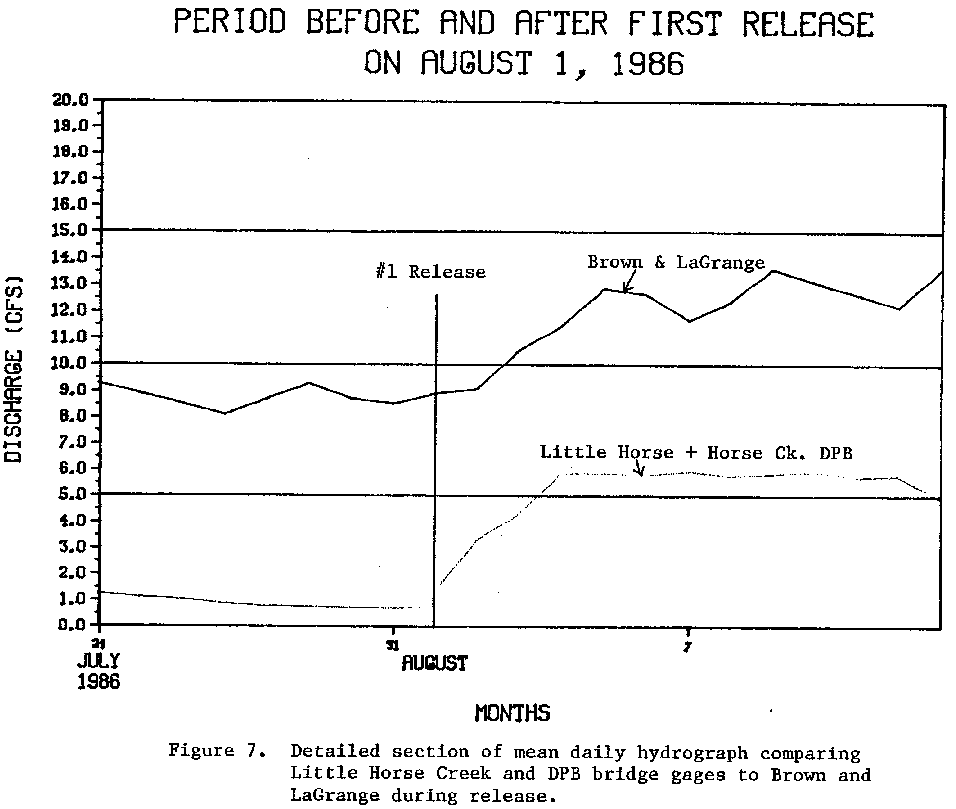
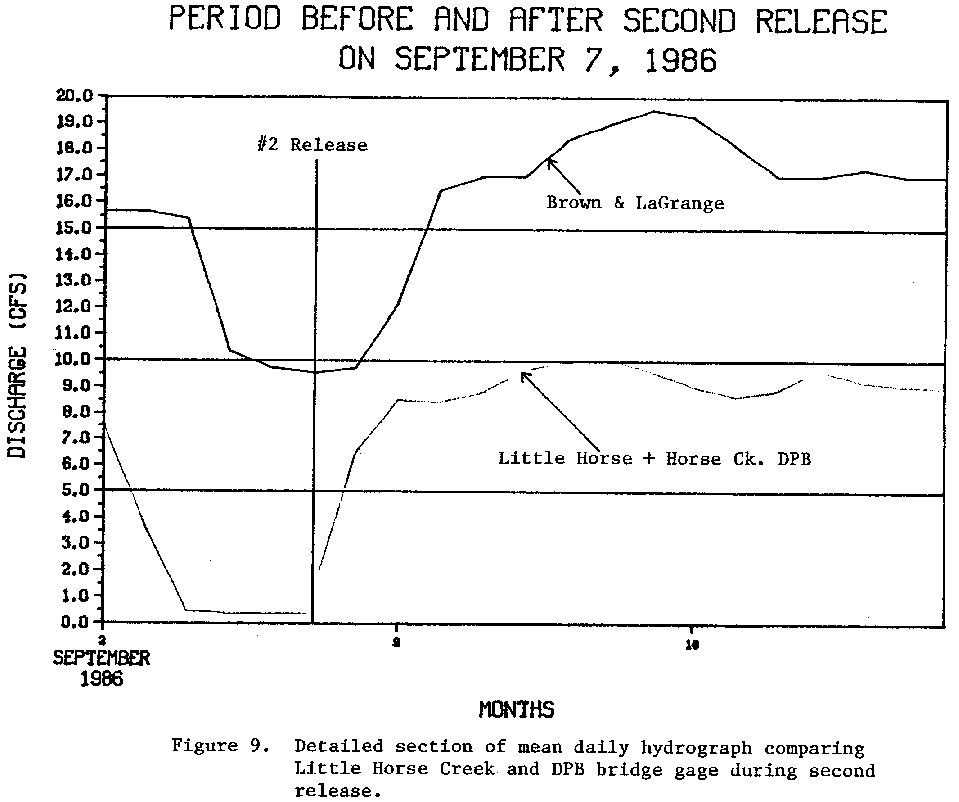
Figures 7, 8 and 9 are expanded plots of the three points comparing the combined flow values below the Wood and Lykins diversion and Horse Creek at DPB bridge with the Brown and LaGrange ditch upon release and shut down periods. These three points are used to show the direct response between the upper and lower gaging stations upon regulation.
The rise in flow (Figure 7) because of regulation of the Wood and Lykins and Springvale diversions on Little Horse Creek on August 1 shows a direct relation to the rise in flow at the Brown and LaGrange ditch. This relation is seen in two ways; first the rise in flow at the Brown and LaGrange ditch occurs approximately 3.5 days after release of water into Little Horse Creek and secondly, the amount of Increased flow is similar between the two stations. Figure 8 illustrates the point at which flows in Little Horse Creek were shut off on September 3, and the corresponding drop in flow at the Brown and LaGrange. The time lag between the two gaging points is approximately 2 days and the amount of flow drop is similar. Release of water on September 7 back into Little Horse Creek (Figure 9) again shows a corresponding rise in flow at the Brown and LaGrange ditch and indicates a 2.5 day time lag with similar flow amounts.
|
|
| |
Conveyance Loss
Calculations of the mean daily flows 10 days previous to regulation
on August 1 at the Wood and Lykins, DPB bridge and Brown and LaGrange
(Figure 7) were compared with calculations of mean dally flows at the
same locations 10 days after release of water and upon stable
conditions.
The combined average dally flow from Little Horse Creek below Wood and Lykins and Horse Creek at DPB bridge for 10 days (July 22-31) prior to any regulation equaled 1.06 cfs. For the 10 day period (August 5-14) after release of water, the combined average dally flow was 5.72 cfs. The average dally flow from Horse Creek at Brown and LaGrange ditch for 10 days (July 24-August 2) prior to any regulation equaled 8.79 cfs. The 10 day period (August 6-15) after release of water upstream and after flow was stabilized equaled 12.86 cfs. (Table III).
                                TABLE III

               Average Flow Before and After First Release
__________________________________________________________________________

     Combined Wood and Lykins and Horse Creek at DPB bridge:
         10 day average daily flow after release =          5.72 cfs
         10 day average dally flow prior to release =       1.06 cfs

         Additional flow to system after release =          4.66 cfs

     Horse Creek at Brown and LaGrange ditch:
         10 day average daily flow after release =         12.86 cfs
         10 day average daily flow prior to release =       8.79 cfs

         Additional flow after release at this point =      4.07 cfs
__________________________________________________________________________
From the flow records over the period before release of water
compared to those after release. It indicates that of the additional
4.66 cfs after release upstream, the Brown and LaGrange received 4.07
cfs of this water-a loss of 0.59 cfs or 13 percent over the period.
Calculations were also done on the second release of water (Figure
9) on September 7, to compare loss values with those of the release on
August 1. The stable period (September 4-6) prior to release of water
back into the Little Horse Creek channel was used below the Wood and
Lykins diversion and at the Horse Creek below DPB bridge site.
The combined average dally flow from these two gages before release equaled .41 cfs over the three day period. For the stable period after release of water (September 9-11) combined flows equaled 8.56 cfs. In comparison the average dally flow at the Brown and LaGrange ditch before release water reached this point for September 6 through 8, equaled 9.65. The three day (September 11-13) average daily flow after the release of water under stable conditions equaled 17.47 cfs. (Table IV).
                               TABLE IV

             Average Flow Before and After Second Release
__________________________________________________________________________

 Combined Wood and Lykins and Horse Creek at DPB bridge:
     3 day average dally flow after release =      8.56 cfs
     3 day average daily flow before release =      .41 cfs

     Additional flow to system after release =     8.15 cfs

  Horse Creek at Brown and LaGrange ditch:
     3 day average daily flow after release =      17.47 cfs
     3 day average dally flow before release =      9.65 cfs

     Additional flow after release at this point =  7.82 cfs
__________________________________________________________________________
In calculating the loss for this period, of the additional 8.15 cfs
upon release upstream, the Brown and LaGrange received 7.82 cfs.--a loss
of .33 cfs or 4 percent over the period.
Comparing the loss values of the first release on August 1 with the second release on September 7, the second release shows a smaller loss than the first by 9 percent. This is probably due to the fact that air temperatures both day and night are lower in the September period than they are during the August period causing evapotranspiration to be lower in September. By looking at the general trend of the hydrograph In Figure 6 an upward shift begins at the end of August and continues throughout the remainder of the study period. Also, the stable period used was right after shutdown and bank storage contributions to streamflow during this time would be higher due to a lowering of the stream water surface.
Dye Study
Performance of the dye study was initiated on the 26 mile study
reach from Little Horse Creek below the Wood and Lykins diversion to the
Brown and LaGrange ditch on August 19, 1986. Two objectives of this
test were: first to confirm the findings from continuous streamflow data
that the relationships observed in flow between the upstream recording
gages and the downstream recording gages are a direct result of Little
Horse Creek water; and secondly, to determine the time of travel of
water from Little Horse Creek to the Brown and LaGrange ditch.
A slug injection of Rodamine WT tracer dye was placed in Little Horse Creek below the Wood and Lykins diversion at 1635 hours on August 19, 1986. The dye was followed throughout the 26 mile study reach. #l Intermediate gaging site and #2 Intermediate gaging site were used as sampling points to help determine when the approximate time of arrival would occur at the final sampling site on the Brown and LaGrange ditch. Water samples were taken before the arrival of any dye and tested with a fluorometer to identify background levels.
Previous to anticipated dye arrival at the Brown and LaGrange ditch, testing equipment was set up and sampling begun at 20 minute Intervals. At 1835 hours on August 22, the leading edge of the dye arrived at the Brown and LaGrange monitoring site. Sampling was continued at 15 minute intervals through the peak which arrived at 2345 hours and through the trailing edge of the dye.
Fluorometer readings in parts per billion are plotted against time on Figure 10. The leading edge of the dye cloud reached the monitoring station on the Brown and LaGrange ditch 74 hours (3.08 days) after being injected into Little Horse Creek. Arrival of the peak concentration was monitored on August 22, at 79 hours and 20 minutes (3.33 days) after injection.
Conclusions
During the period June through October 1986, Little Horse Creek and
Horse Creek near and upstream of LaGrange, Wyoming was studied to
determine if regulation of upstream diversions influence flows at the
Brown and LaGrange diversion. Through continuous streamflow records it
was shown (Figures 7, 8, and 9) that water from Little Horse Creek below
the Wood and Lykins diversion does, in fact, reach the Brown and
LaGrange diversion some 26 miles downstream. Further results of a dye
study between these two points confirm findings of the continuous
streamflow records (Figure 10).
REFERENCES
Cobb, E.D. and J.F. Bailey. 1965. Measurement of Discharge by Dye- dilution Methods. Surface Water Techniques Book 1, Chapter 14, U.S. Geological Survey.Babcock, H.M. and J.R. Rapp. 1952. Reconnaissance of the Geology and. Ground-Water Resources of the Horse Creek-Bear Creek Area Laramie and Goshen Counties, Wyoming, Circular 162, U.S. Geological Survey.
Brakensiek, D.L., H.B. Osborn and W.J. Rawls. 1979. Field Manual for Research in Agricultural Hydrology. Agriculture Handbook No. 224, U.S. Department of Agriculture.
Dockery, W.L. 1940. Underground Water Resources of Horse Creek and Bear Creek Valleys, Southeastern Wyoming, Bulletin No. 30, State Geological Survey of Wyoming.
Hubbard, E.F., F.A. Kilpatrick, L.A. Martens, and J.F. Wilson, Jr. 1982. Measurement of Time of Travel and Dispersion In Streams by Dye Tracing. Techniques of Water-Resources Investigations of the United States Geological Survey. Book 3, Chapter A-9, U.S. Geological Survey.
Love, J.D. and A.C. Christlansen. 1985. Geologic Map of Wyoming, U.S. Geological Survey, 1985.
Lowry, M.E. and M.A. Crist. 1967. Geology and Ground-Water Resources of Laramie County, Wyoming, U.S. Geological Survey, Water-Supply Paper 1834.
Rantz, S.E. 1982. Measurement and Computation of Streamflow: Volumes 1 and 2, U.S. Geological Survey, Water Supply Paper 2175.
Wilson, J.F., Jr. 1968. Fluorometric Procedures for Dye Tracing. Techniques of Water-Resources Investigations of the United States Geological Survey. Book 3, Chapter A-12, U.S. Geological Survey.
APPENDIX I
STUDY AREA MAP
Water Resources Publications List
Water Resources Data System Library |
Water Resources Data System Homepage